This piece looks at issues related to the “Great Rotation”, the view that U.S. investors are in the early stages of a reallocation of their wealth out of bonds and into stocks. The interesting charts are at the end, so if you’re pressed for time, just read the summary, and fast forward.
Summary
- The relevant universe of financial assets is composed of equity (stocks), credit (bonds), and money (cash). The extent to which individual sectors of the economy (Households, Pension Funds, Life Insurers, etc.) and the economy in aggregate have allocated wealth to these categories can be determined from the Flow of Funds report.
- For every asset in existence, someone must willingly hold it. Prices will adjust to ensure a holder is found.
- The “supply” of an asset is the total market value of it in existence. Changing market prices are the means through which asset supply expands or contracts to meet demand.
- “Asset Shortages” are actually income or yield shortages.
- “The Great Rotation” entails two portfolio processes: (1) a reduction in the preferred allocation to bonds, relative to cash and stocks, and (2) an increase in the preferred allocation to stocks, relative to cash and bonds. These processes do not represent a “re-allocation” of wealth from bonds into stocks. They instead represent a separate destruction of wealth in bonds, and a separate creation of wealth in stocks.
- Contrary to market narrative, the aggregate U.S. investor is not “underweight” U.S. equities, but is instead “overweight” (but not extremely so), relative to the average of the last 60 years. Sectors notably overweight: Pension Funds, Life Insurers, and Households. Sectors notably underweight: Property-Casualty Insurers and Foreigners.
- If a “Great Rotation” is coming, it may be a rotation into cash (an increase in the amount of a portfolio that the average investor wishes to allocate to cash). Of all asset classes, cash is clearly the most hated–and with some justification, given the zero interest environment. If the rate environment normalizes (and there is nothing to say that it must), cash is likely to be the prime beneficiary, at least relative to bonds.
The Universe of Financial Assets
We can divide the universe of financial assets into three categories: (1) money, (2) credit, and (3) equity. Money (or “cash”) is whatever the government designates as tender for the payment of taxes and fines. Under this definition, dollar currency and dollars deposited at a bank are money. Treasury bills, money market mutual fund shares, and open market paper are not. Credit is a claim to be paid money by some entity. Equity is ownership of an entity, including its monetary income. The Flow of Funds report (Z.1) provides detailed information on the money, credit and equity assets of each sector of the economy.
Let’s take a closer look at credit assets. The following chart uses Flow of Funds data to decompose the universe of dollar-denominated credit assets by type and share from 1951-2013:

The reader will note that there is a significant amount of double-counting in this decomposition. For example, we see the category “agency securities”, and we see the category “mortgages.” Both of these credit assets are associated with the same fundamental act of lending.
If a government-sponsored enterprise (GSE) sells a debt security, and uses the proceeds to purchase a mortgage loan from a bank, the GSE will own a credit asset–the mortgage loan. But the person who purchased the debt security from the GSE will also own a credit asset–the debt security. In this way, the same fundamental act of lending gets multiplied into two securities: one covering the obligation of the homeowner to pay money to the GSE, and the other covering the obligation of the GSE to pay money to the investor holding GSE debt. This process is called “financial intermediation”; it is what financial institutions do.
In truth, anyone can engage in financial intermediation–the task is not limited to financial institutions. Anytime a person purchases an asset with money that she does not own, and that she has to get from somewhere else by borrowing, she is engaging in financial intermediaton.
When financial intermediators purchase and hold assets, they do not change the quantity of assets that the rest of the economy must hold. They only change the mix. Some examples:
- Bank of America ($BAC) buys a treasury bond. If it funds the purchase by creating and selling its own debt security, then it takes the treasury bond out of the market, and puts it’s own debt security in (a $BAC bond that didn’t previously exist). If it funds the purchase by creating money (in the various ways that banks create money), then it takes the treasury bond out of the market, and puts cash in (which didn’t previously exist). Notice that this activity is very similar to QE, which is an activity that any depository institution can engage in–not just the Federal Reserve. If it funds the purchase by selling equity, then it takes the treasury bond out of the market, and puts an equity security in (a share of $BAC which didn’t previously exist).
- A Hedge Fund manager borrows a share of stock from person A, and sells it to person B–he goes “short.” Through the sale, the Hedge Fund manager is taking cash out of the market, and putting a new share of stock in. It’s a new share of stock because the person who originally lent it to the hedge fund manager still owns his shares, but the person who bought it from the hedge fund manager, who took the other side of the short, also owns shares. The supply of shares has been expanded through the stock lending process, just as the supply of money gets expanded through the cash lending process.
The following chart shows the share of credit assets held by financial institutions (blue) and the share held by the rest of the economy (green) from 1951-2013 (Z.1 Flow of Funds):

Here, financial institutions include not only the traditional commercial banking system, but also the entire shadow banking system: money market mutual funds, REITs, finance companies, funding corporations, etc.
Neglecting the role of equity in the financial sector (which is small relative to assets) we can conclude from the chart that somewhere around 1/3 of all credit assets cover genuine acts of lending from owners of money who want to lend it to users of money who want to borrow it. The other 2/3 cover the borrowing and lending of intermediaries whose job it is to get the money across. When we try to determine how much wealth each sector of the economy, and the economy as a whole, has allocated to the three asset classes, credit assets associated with intermediation can be ignored, since the actual owners of the economy’s wealth–the non-financial sector–do not have to hold them.
A Model For Thinking About The Great Rotation
Financial assets follow two fundamental rules:
(1) For every share of every asset in existence, someone must willingly hold that share at all times. If no one can be found who wants to hold a share, its market price will fall until someone is found.
(2) The total “amount” or “supply” of a financial asset is the total market value of it in existence: the number of shares outstanding times the market price. Asset “amount” or “supply” is therefore flexible for all assets except cash, whose market price is always unity. If there is more financial wealth that wants to be allocated into an asset than exists of that asset, the market price of each share of the asset will rise, which will expand the supply of the asset so that the demand can be satisfied.
From the perspective of someone seeking to buy, the “market price” is defined as the lowest “ask” price being offered. From the perspective of someone seeking to sell, the “market price” is defined as the highest bid price being offered. In a market with free exchange, this price adjusts to ensure that both rules are satisfied.
Investors tend to describe the Great Rotation as a movement of money and people: money “comes out of” bonds, and “goes into” stocks… investors “leave” the bond market and “enter” the stock market. We sort-of know what investors are trying to say when they say this, but the description is wrong.
Money is not something that can go into or come out of assets; rather, it itself is an asset that is traded for other assets. The offered rate of exchange is the price. Changes in the price can create the perception that money is moving, but, in reality, nothing needs to be moving at all. Any movement that does occur is incidental to the underlying process.
Likewise, investors cannot leave or enter any asset class. All they can do is fight with each other over who will hold each asset class, offering to exchange money at various rates in exchange for the privilege of holding something else. The consequence of shifting preferences and exchange rates may be a destruction or creation of wealth in various places, but it is never a “movement” of wealth.
An intuitive example will help clarify. Suppose that the financial universe is composed of 6 persons, each with a portfolio of assets. Each person starts out with 10 shares of stock, with each share worth $1 at market prices (therefore, $10 worth of stock in each portfolio, $60 aggregate supply of “stock” in the total universe), 10 bond certificates, each worth $1 at market prices (therefore, $10 worth of credit in each portfolio, $60 aggregate supply of “bond” in the total universe), and 10 dollar bills ($60 worth of “cash” in the total universe). The allocation is therefore 33.3% to stocks, 33.3% to bonds, and 33.3% to cash.

Each investor is value-insensitive, and makes buy and sell decisions strictly based on what is necessary to achieve desired allocations. Now, consistent with a “Great Rotation”, suppose that each investors’ desired allocation shifts. Each investor decides that he wants to allocate a larger portion of his assets to stocks, and a smaller portion of his assets to bonds. He wants to keep his cash allocation constant. We’ll assume he wants to allocate as follows: 33.3% to cash, 6.6% to bonds (credit), and 60% to stocks (equity).
Naturally, investors are going to take their cash and try to use it to buy shares of stock. To avoid lowering their cash allocations, which they want to keep constant, they’re going to try to sell bonds in the equivalent amount. But there’s a critical problem. When they try to buy and sell shares, they are trying to buy and sell shares from and to each other, through the exchange. Right now, there isn’t enough stock on sale to meet the desires of all the buyers–indeed, there isn’t any, because everyone is trying to buy. Likewise, there are too many bonds on sale for the amount of interested buyers–of which there are none. What will happen?
The answer is simple. Since the investors are value-insensitive, they each are going to increase their bids on stocks, and decrease their asks on bonds, until they get what they want–a trade. Thus the market price (highest bid) on shares of stock will rise, and the market price (lowest ask) on bonds will fall. As the market price of each asset rises and falls (respectively), the supply is going to increase and decrease (respectively), making it possible for each investor to meet his desired allocation, and for the aggregate group to meet its desired allocation.
The shifting bidding and asking process will stop when prices have shifted such that the bid on stocks is $1.8 and the ask on bonds is 20 cents. Each investor will then have 6.6% of his portfolio in bonds at market prices, 60% in stocks at market prices, and 33.3% in cash, as desired. If the prices shift any farther than that, the investors will need to go in the other direction to preserve the desired allocation–they will need to sell stocks and buy bonds. This is what will create an ask for stocks and a bid for bonds above and below $1.8 and 20 cents respectively.
Notice that all that is theoretically required to change the allocations is a bid or ask–no actual exchange of shares needs to take place. The exchanges are incidental to the process. The “paper” wealth that is created and destroyed in markets is not created or destroyed through physical transfers, but through simple bids and asks–alterations in individual preference, nothing more.
The moment someone bids $1.8 for each share of stock, the total supply of stock–the total market cap–will have magically increased 1.8-fold. Assuming no trades, each person will magically have $18 worth of stock in his portfolio, at prevailing market prices. Likewise, the moment someone bids 20 cents for each bond certificate, the total supply of bonds will have magically decreased by 80%. Assuming no trades, each person will have $2 worth of credit in his portfolio, at prevailing market prices. The final universe will look like this:
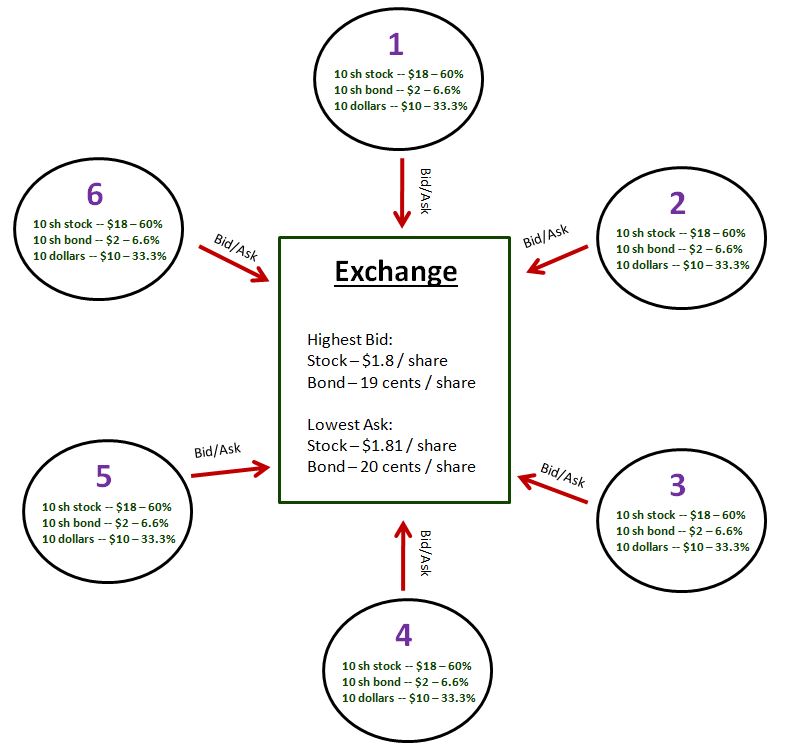
Voila! 33.3% cash, 60% equity, 6.6% credit–and not a single trade was even necessary. Now, trades probably will take place, and there is no guarantee that we will ever reach an equilibrium. The fight over who will hold what asset may never end–especially considering that they are not likely to be value-insensitive, and that the shifting prices will have reflexive effects on their perceptions and preferences. In the real world, markets never reach equilibrium. But if they were to reach an equilibrium in this case, we know for certain that the price of each stock share would be $1.8, and the price of each bond share would be 20 cents.
What happened in this “Great Rotation”? Did wealth move from bonds into stocks? No. Two distinct and separate processes took place. Wealth was destroyed in the bond market due to a falling allocation preference to bonds, and created in the stock market due to a rising allocation preference to stocks. The stock prices could have gone up without the bond prices falling, and the bond prices could have gone down without the stock prices rising.
Asset Shortages
The above example illustrates that there can never be a true shortage of a non-cash investment asset. If the demand for the asset exceeds the supply, the market price of the asset will rise, magically creating new supply, and vice-versa. What there can be, however, is a shortage of yield. The supply of equity and credit at market value might increase in response to increased demand, but this won’t increase the quantity of dividends, coupon payments, and interest payments that investors are really after, or should be after.
Ultimately, a shortage of yield is the mirror image of an excess of cash, a condition in which there is more cash in the economy than any investor wants to hold idly in a portfolio at a zero interest rate (because the investor needs income, or because the banking system is suspect and the investor wishes to avoid deposit risk), but also more cash than anyone wants to put to use in new productive investment, which would create new income that could be used to sustainably pay interest to lenders. The frustrated investors who are stuck holding the cash therefore try to exchange it for existing yielding assets, which pushes up prices, sometimes to unreasonable levels–but again, this doesn’t solve the problem, because no new yield, which is what investors are really facing a shortage of, is created.
Some have worried that an increasing propensity on the part of corporations to use their earnings to buy back shares could create an equity shortage in the market. This fear confuses share count with equity supply. The supply of equity is the total market value of shares outstanding, not the total number of shares. If a corporation buys back its shares, the market value outstanding need not fall. Indeed, to the extent that the market is functioning efficiently, the price of each share will rise to reflect the rising earnings per share, which will keep the market value exactly constant, though each shareholder that holds on as others are bought out will end up with a greater share of that market value.
The chief risk of an asset shortage is that it cause assets to trade at unsustainable valuations. This is a risk in the credit market because credit has a price above which it cannot coherently trade–the price corresponding to a 0% yield to maturity (YTM). Absent negative deposit rates or perceived credit risk in deposits, there is no reason for credit to ever trade at a higher price than 0% YTM. For this reason, the supply of credit does have a practical bound.
Asset shortages can also emerge in the equity market if the market value of equity, properly valued based on earnings or book, does not grow at the same pace as the supply of credit and money. If investors choose to maintain a constant allocation to equity, credit, and cash respectively in the presence of such a dynamic, the price of equity shares will necessarily have to rise beyond what fundamental valuation can justify. This very interesting phenomenon has happened at various times in market history (though it is not happening at present). It will be thoroughly investigated in the next piece.
Using the Flow of Funds to Determine The Aggregate U.S. Financial Portfolio
Asset allocation is the single most important decision that portfolio managers have to make. How much do I allocate to equity, how much to credit, and how much to cash? Where in the equity space should I focus? Where in the credit space? Even short-term traders have to make this decision–indeed, they have to make it on a daily basis, when they decide what market trends to ride.
Because asset allocation is so important, there is significant value in knowing how the market is allocated at a given time. An extreme allocation can be a sign of a coming reversion, which will affect market prices. Fortunately, information about allocation–of individual sectors and of the economy as a whole–can be extracted from the Flow of Funds report. The challenge, of course, is to avoid double counting in the credit space. Two-thirds of all credit assets in the economy are held by the financial sector. But the financial sector doesn’t actually “own” the underlying loans from which these intermediary assets spawn out–it simply “transports” the loans from root lender to root borrower.
Person A might borrow from Person E. But with intermediation, what actually happens is: Person A borrows from Financial Entity B which borrows from Financial Entity C which borrows from Financial Entity D which borrows from Person E. The total quantity of loans is just one–the loan from Person A to Person E. But with intermediation, we have four credit assets that spawn out–the loan from E to D, D to C, C to B, and B to A. With respect to asset allocation, we’re concerned with what the owners themselves are holding, how their wealth is being allocated, so we need to ignore this intermediation.
The most reliable way to eliminate double counting in assessing the equity, credit, and cash allocation of the overall economy is to look only at two variables: total quantity (market value) of equity, and total quantity of non-financial liabilities, that is, liabilities of Households, Non-Financial Corporations, State and Local Governments, the Federal Government and the Rest of the World. Ultimately, total non-financial liabilities are what money and credit are made out of. When a non-financial liability is held by a regular entity–such as you or I–it takes the form of a credit asset–a bill or bond. But when it is held by a depository institution–a private bank, or the Federal Reserve banks–it takes the form of actual money.
We know that when the Federal Reserve buys treasury bonds, it turns a bond into money. This action is not limited to the Federal Reserve. A private bank can do it too. When a private bank borrows an idle deposit from another bank, or from a depositor, or from the Fed (which creates deposits from thin air), and uses the money to purchase a bond, it puts new money into the economy that did not previously exist, and that investors have to hold, and takes the bond out. This is hardly different from the “quantitative easing” that the Federal Reserve conducts when it does the same thing.
The following chart shows non-financial credit liabilities (the seeds of money and credit) and equity assets as a % of total financial assets in the Overall U.S. Economy from 4Q 1951 to 1Q 2013, with money and credit in the negative (to delineate on the chart), and recessions shaded in gray. Note that the total quantity of non-intermediated financial assets in the U.S. economy is around $60T:

The first thing to notice is that contrary to the market’s current narrative, investors are not underallocated to equities. At 39.23% (extrapolated to an S&P level of 1650, August 2013), the allocation is higher than the historical average of 34.63%, though not by an extreme amount.
To double check our work, we can calculate the same value differently, by taking the financial universe to be composed of M2 (a valid proxy for total cash in the economy), equities, and credit assets not held by non-mutual-fund financial institutions. The following chart reveals a similar allocation to the one above, but splits money and credit apart:
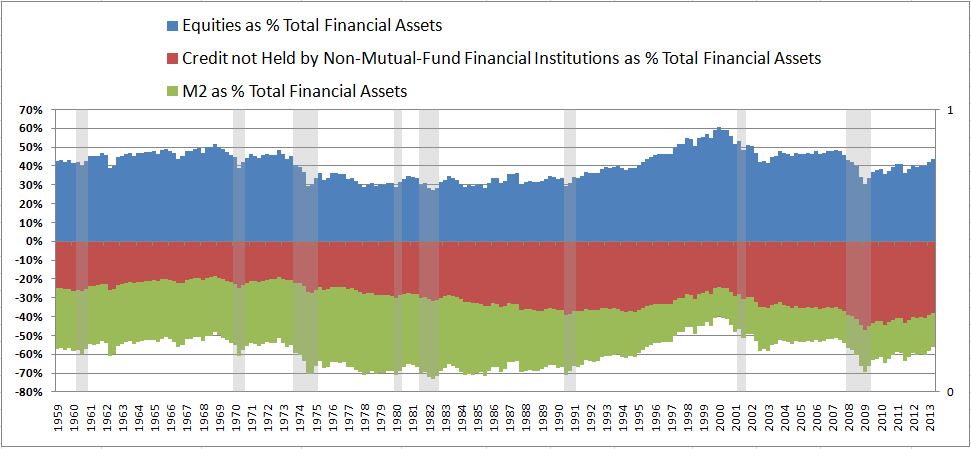
As the chart shows, the asset class to which investors are the most underallocated is cash. Per the chart, cash represents 18% of total assets, versus a 54 year average of 29%. Bonds, in contrast, represent 38% of total assets, versus a 54-year average of 30%. If a great rotation is coming, it could well be a rotation out of bonds and into cash (a shift in the relative preference for each, provoked by rising interest rates).
The following chart shows equities, credit, and cash as a % of Total Household Financial Assets, with mutual fund holdings included, but not pension reserves (all subsequent allocation charts will include mutual fund holdings):

Note that total household financial assets amount to approximately $35T, not including pension fund assets. Again, the chart makes it clear that households are not underallocated to equities. If anything, they are overallocated to credit and equity, and underallocated to cash. As the economy improves and interest rates rise, the “Great Rotation” everyone is anticipating may well end up being a rotation back into cash–unquestionably the most hated of all asset classes.
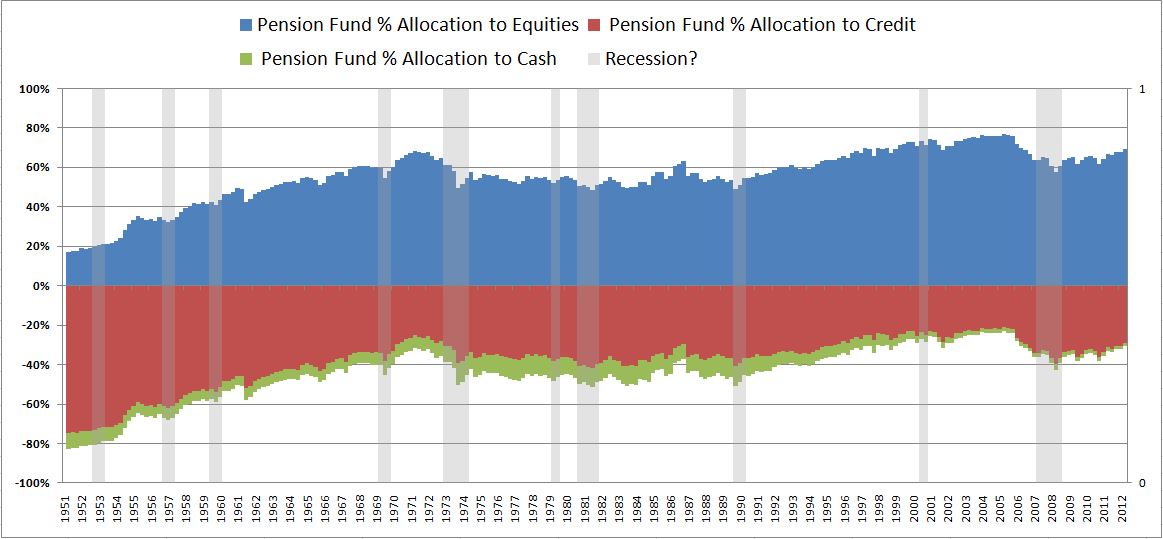
The following chart shows the composition of Total Pension Fund Financial Assets (~$6T in total). Pension Funds are clearly overallocated to equities, and have been trending towards a higher allocation since the 1950s.
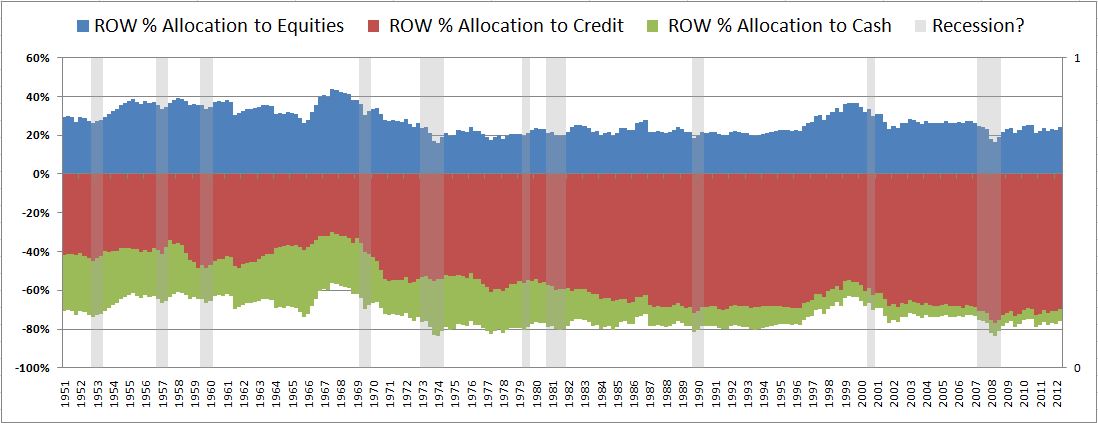
The following chart shows the composition of the total financial assets (around $15T) of the Rest of the World. The Rest of the World is underallocated to U.S. equities relative to cash and bonds:
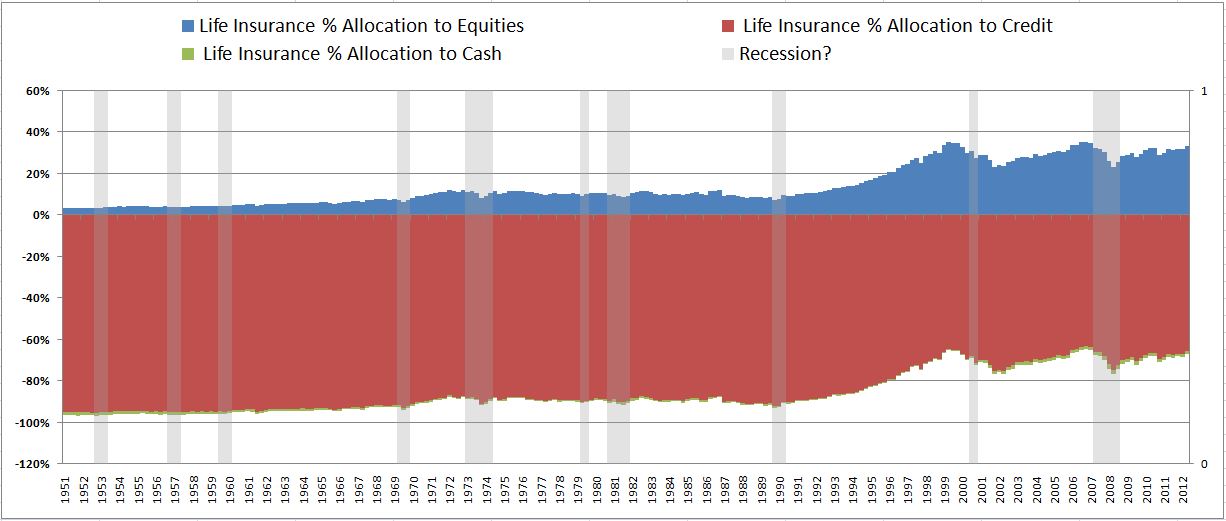
The following chart shows the composition of total financial assets of Life Insurers (~$5T). Life Insurers have historically been trending towards a higher equity allocation, which is near record highs:
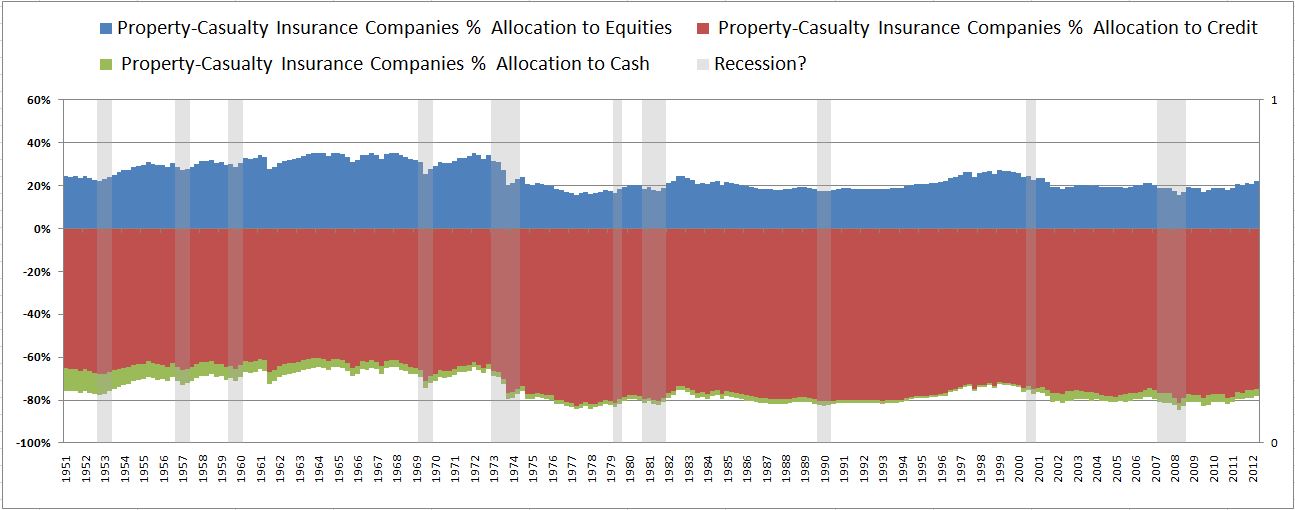
The following chart shows the composition of total financial assets of Property-Casualty Insurers (~$1.2T). Property-Casualty Insurers are underallocated to equities relative to the past:
In comparison with the past, the overall market is clearly tilted towards a higher equity allocation. What this ultimately reflects is that equities have a higher market value relative to other assets in existence than they used to have–there is a greater supply of them to be held than in the past. As we will show in subsequent pieces, the relative supply of equities (or, alternatively, the aggregate allocation to them) is tightly anti-correlated (~95%) with future returns.
The fact that the supply of equity is elevated right now suggests that equity investors face the prospect of lower future returns than they have received in the past (something that no one should find surprising, given where profit margins are). But the likely returns are not unacceptably low–and still significantly more attractive than what any other asset class can offer. To give a brief preview of what will be discussed in a later post, using the current allocation to equity, I estimate around 5%-7% per year total return (including dividends) over the next 10 years, based on an August 2013 SPX price of 1650:

Pingback: Earningless Bull Markets: Why Do They Happen? | Philosophical Economics
Pingback: Hot Links: Amaze Your Friends! | The Reformed Broker
Pingback: 10 Tuesday PM Reads | The Big Picture
“If a corporation buys back its shares, the market value outstanding need not fall. Indeed, to the extent that the market is functioning efficiently, the price of each share will rise to reflect the rising earnings per share, which will keep the market value exactly constant, though each shareholder that holds on as others are bought out will end up with a greater share of that market value.”
I don’t follow this argument. If a company has $500MM cash with a market value of $1B wouldn’t buying half the outstanding shares at the current market price leave $0 cash and $500MM market value with share price unchanged?