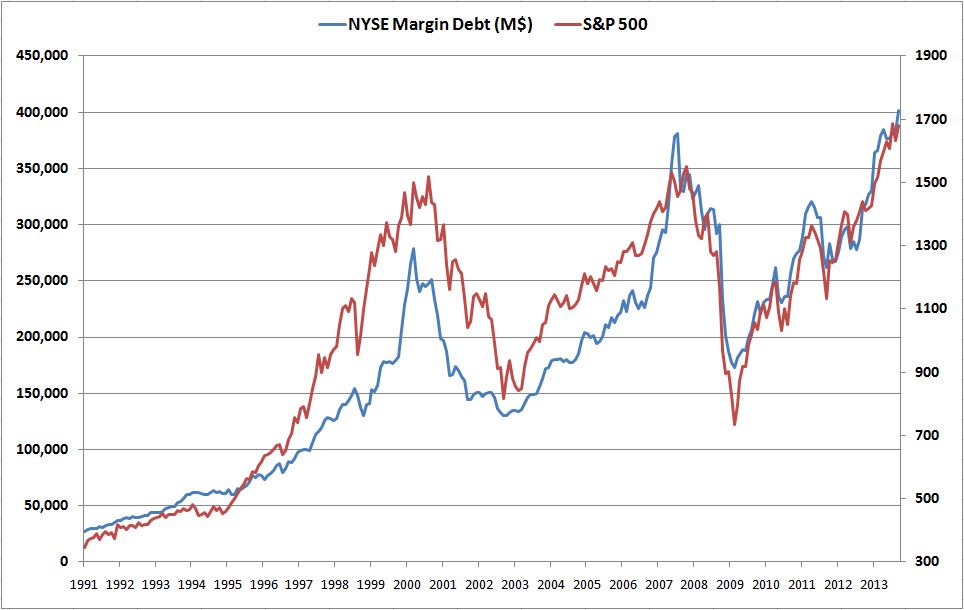
NYSE Margin Debt just reached another record high, and an increasing number of market skeptics are expressing concerns. They reason as follows. A willingness to buy stocks on margin suggests confidence and optimism. But markets don’t perform well when investors are already confident and optimistic. Moreover, people invested on margin are less able to tolerate price fluctuations. As their presence in a market grows, so does the risk that otherwise healthy challenges to the market’s advance will provoke rapid, self-fulfilling unwinds of positions.
To ground these concerns, the skeptics appeal to history. They point out that extreme margin borrowing was the primary cause of the 1929 stock market crash, and that the market crashes of 2000 and 2007 both involved blow-off peaks in margin debt.
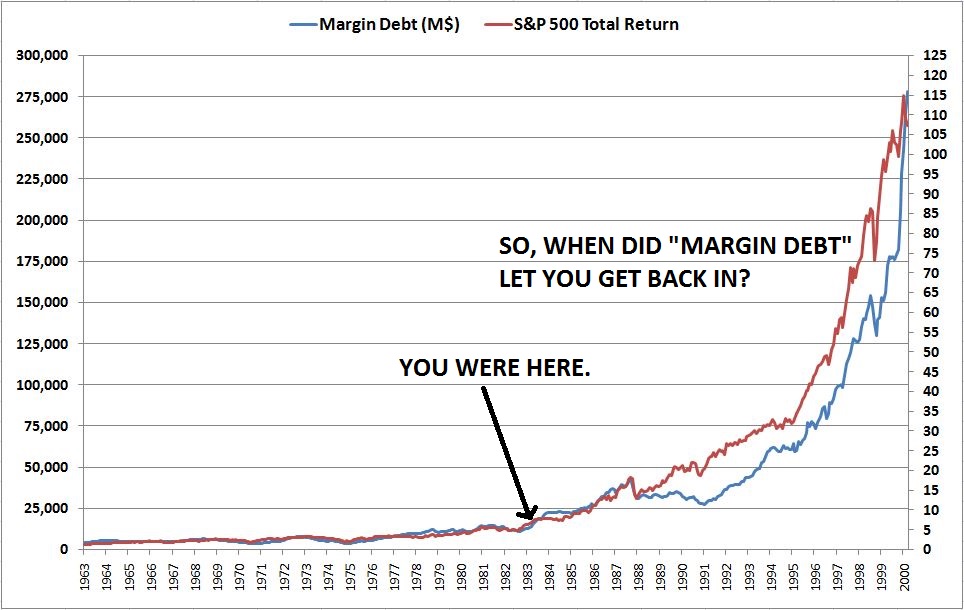
If you think the chart above looks frothy, I have some charts to show you that are even frothier. To start, take a look at the chart below, which shows margin debt alongside a market index from an unspecified period of history. The x-axis is in years.
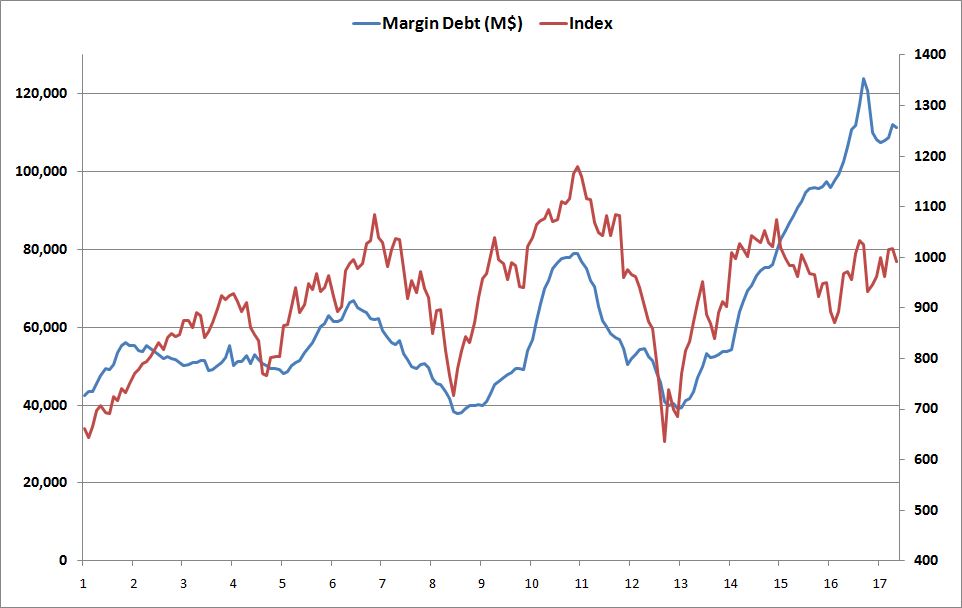
It’s clear that investors in this chart are not respecting downside risk. They’ve pushed their margin debt levels well above the $70B-$80B level that presaged nasty market crashes at prior peaks (years 6 and 11). To make matters worse, the index itself is showing signs of weakness, failing near the prior peaks and now slouching downward. If everyone is already maximally invested in this market, as evidence by the large jump in margin debt, who is going to buy it when it finally tips over, and the forced selling begins?
If you were an investor in this market, how would you position yourself? Take note of the answer, and we’ll fast forward through time to see how things turn out. The following chart shows the market’s evolution over the next five years.
Wait, what is going on here? The margin debt was supposed to fuel another ugly correction, but that hasn’t happened. It pulled back briefly, but now it’s right back up at a record high, 25% higher than when we initially became concerned. Is the herd being smart here? Is this going to end well?
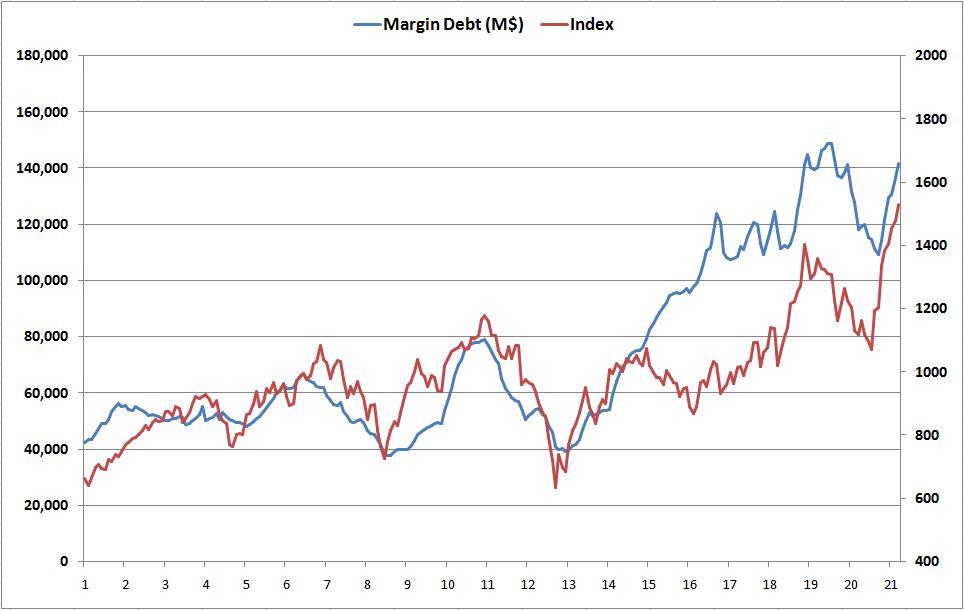
Now, to the moment of truth. Let’s suppose that you are a participant in this market holding cash. What would you choose to do? Would you jump in alongside the rest of the margin-heavy buyers, or would you step aside in favor of caution, discipline, patience, restraint–the venerable traits that “wise” investors demonstrate?
If you would choose patience and restraint, I’ve got news for you: you would be missing out on one of the greatest bull markets in history. Far from some bubble about to go bust, what we’ve been charting and discussing is the S&P 500 from January 1963 to March of 1983. To conceal the chart’s identity, I’ve multiplied the index and margin debt level by a factor of 10. The following chart shows the true numbers of each.
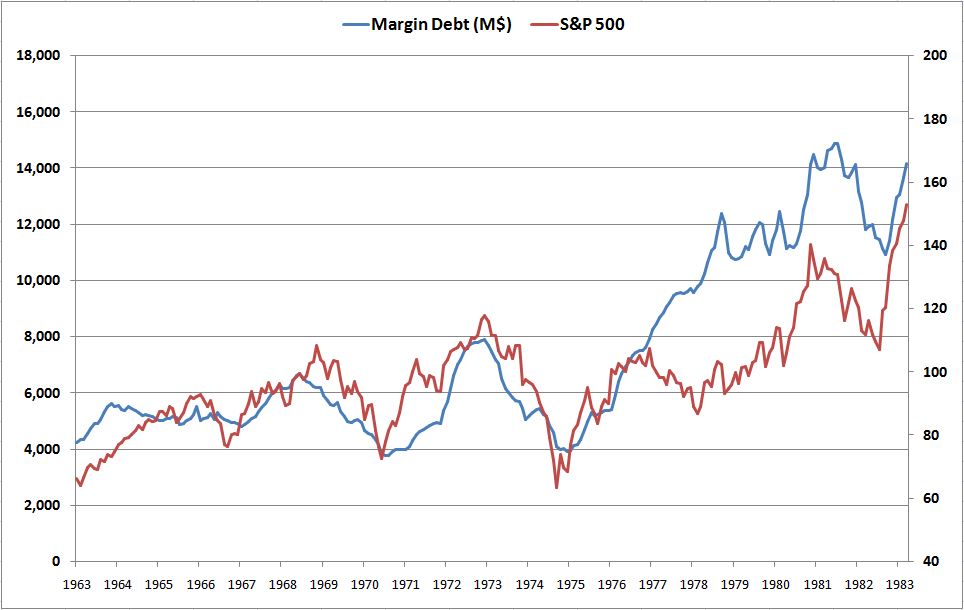
The following chart offers a longer-term perspective:
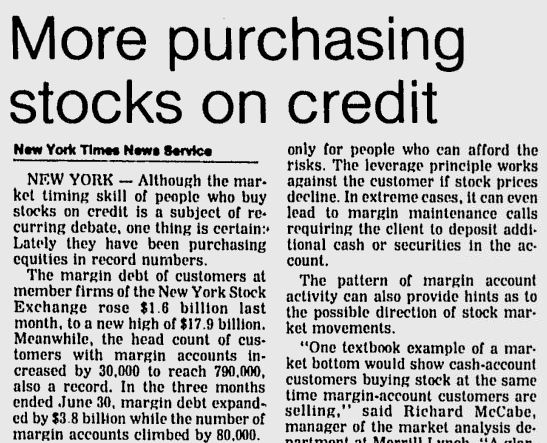
An investor can sound wise and insightful by highlighting the risks of record margin borrowing, suggesting that individuals are repeating the mistakes of 1929, but the argument is no more valid now than it was when it was made in August of 1983:
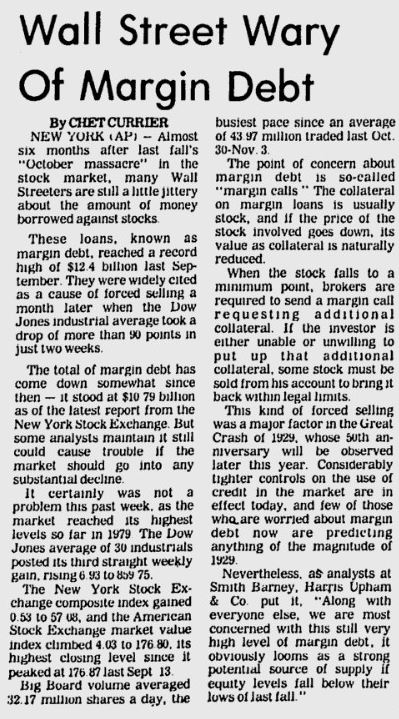
Or when it was made in March of 1979 (what turned out to be a magnificent long-term entry point for investors):
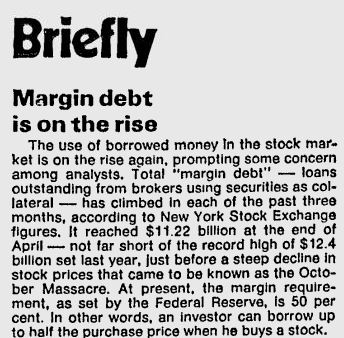
Or two months later, in May of 1979:
To be clear, I’m not suggesting that the October 2013 market opportunity is analogous to the market opportunities of August 1983 or March 1979. Not even close. The valuations, earnings growth prospects, and demographics that underpin the current market are substantially different from what they were then, and the future returns are almost certain to be lower. But the example illustrates a deeper property of margin debt that those who worry about it often forget. Margin debt rises with the market’s price level and total capitalization. It always has. The reason that margin debt is at a record high right now is that the market is at a record high. That is also the reason it was at a record high in 1983, and continued to make new highs for years thereafter.
The following chart shows the annual price change in the S&P 500 alongside the change in NYSE margin debt from January 1960 to present. The correlation is clear:
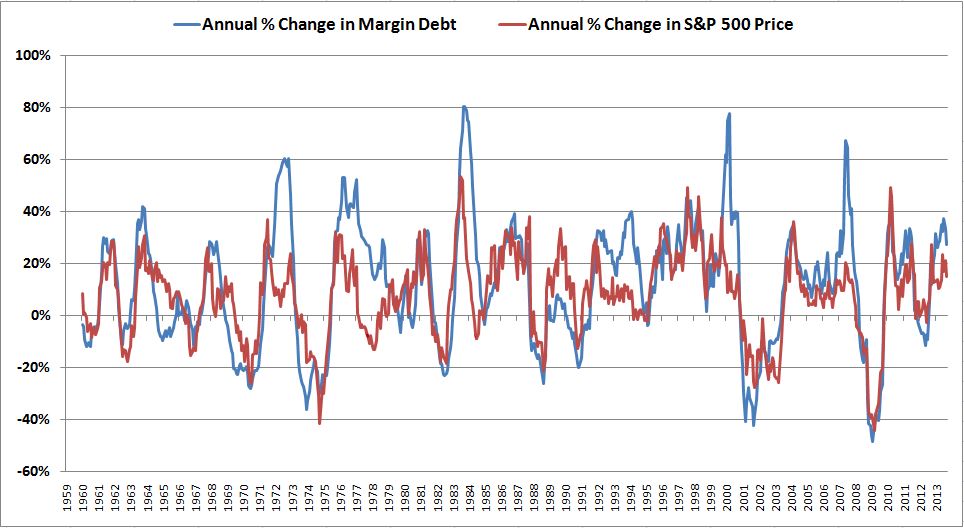 When we scrutinize the chart closely, we see that there have been a number of times in history when margin debt increased significantly faster than the S&P 500. This happened, for example, in August 1972, in March 2000 and in July 2007. It goes without saying that those were not ideal times to be taking on market exposure. One might therefore argue that if margin debt is quickly rising without a similar rise in the index level, then investors should proceed with caution. But even if the argument is true, it doesn’t matter right now, because we’re not in that situation. The trends we’re seeing with respect to the growth of margin debt are perfectly normal for a bull market. Continual new highs in margin debt are happening alongside continual new highs in the market itself, and the pace of growth of the two are not far off. Certainly, the new highs we’ve been making, and the speed at which we’ve been making them, could be increasing the risk of future downside. But the driver of the increased risk is the price advance itself, not the increase in margin debt.
Now, why does total margin debt rise with the level and total capitalization of the market? There is a simple, intuitive answer. In any environment, a certain percentage of investors borrow against their portfolios. They borrow for a number of reasons. Examples include: (1) They may be engaged in investment strategies that hedge and pare risk by applying leverage to uncorrelated assets. (2) Margin debt might be the cheapest type of debt they have access to, and therefore they may use it to pay off other more expensive debts. (3) They might be waiting for money to arrive at a broker, and need temporary liquidity to fund purchases. Or (4), they might just be really bullish and really reckless.
We should expect the amount of margin debt that these investors take on to vary with the size of the portfolios they are borrowing against. Thus, we should expect the total quantity of margin debt in existence to vary with the total capitalization of the stock market (the sum of the value of all equity portfolios). That is roughly what we see.
The following chart shows NYSE margin debt as a percentage of the total market capitalization of all equities (Z.1: market value of financial plus non-financial corporate equity liabilities).
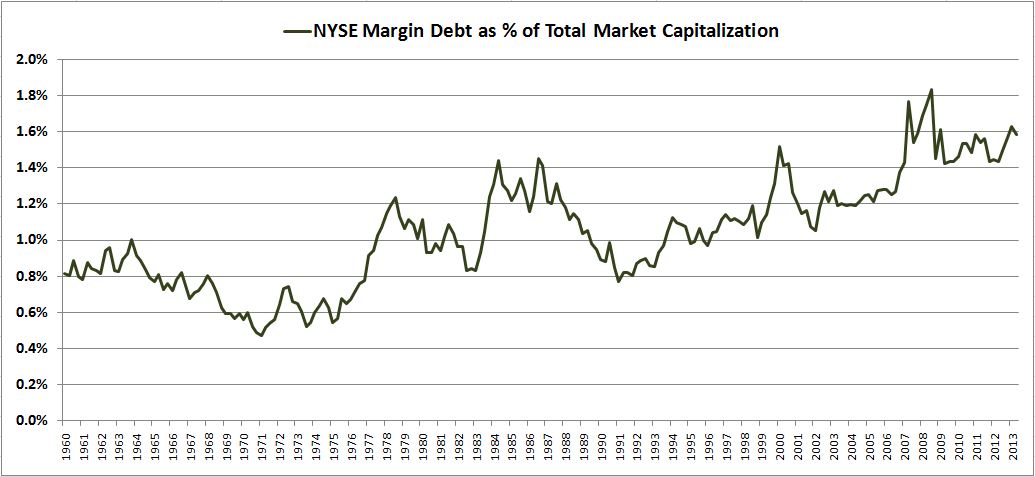 This chart is the only margin debt chart that matters. It puts worries about margin debt into proper perspective. When we talk about margin debt, we’re talking about a tiny portion of the aggregate investor portfolio. That portion has hardly changed since the 2009 low–and in total portfolio terms, it has hardly changed since the late 1970s.
Suppose that the S&P is at 1350, and that you own 100 shares of it. You’re really bullish, so you decide to go 200% long in your portfolio, adding another 100 shares on margin. Shortly after you add the shares, a 20% correction occurs. The S&P falls from 1350 to 1080. The odds are very high that you’re going to be forced to sell–if not by your broker, then by your amygdala. Your situation in that respect is no different from the situation of a bullish investor who owns 100 shares of the S&P at 1700 and adds another 100 on margin before getting caught in a 20% correction to 1360. Nominally, he has more debt than you, but he also has a larger net worth. In portfolio-adjusted terms, the level of debt is the same, and so is the loss. Therefore, the felt pressure to unwind is the same.
Now, one can argue that a 20% correction is more likely from 1700 than from 1350 because 1700 is a richer valuation. The point conflicts with the data, of course, given that we actually experienced a 20% correction from 1350 in 2011, and haven’t come close to experiencing one since, despite much loftier valuations. But the point makes sense: more important considerations aside, valuation matters, and 1350 on the S&P is more attractive than 1700.
However, if the criticism of the current market is its valuation (a potentially legitimate criticism that Bulls should take seriously, even if they disagree), then there is no reason to bring up margin debt. Margin debt is not what distinguishes current market conditions from those of ’09, or of ’11, or of ’84, or of ’86. As a percentage of assets, margin debt has not substantially changed relative to those years. Aside from the dramatically reduced interest cost, the debt looks and feels exactly the same to present market participants as it looked and felt to market participants back then–representing, in aggregate, between 1.4% and 1.6% of total equity assets.
The reader will notice that margin debt as a percentage of total stock market capitalization has gradually increased since the early 1990s. Market skeptics will want to attribute this increase to “froth” and “lack of discipline.” But there is a better explanation. Hedge funds have grown dramatically since the early 1990s. The strategies they employ to smooth out and optimize their risk-adjusted returns involve more leverage than the rest of the market has traditionally used. Additionally, the cost of borrowing against a portfolio has fallen significantly since the early 1990s. Borrowing on margin is cheaper now than it has ever been, not only because interest rates are at record lows, but also because brokerage competition has produced an outcome where clients are offered much better terms. Finally, with the development and mass expansion of online trading, portfolios are easier to monitor and quickly adjust. This reduces the stress of being on margin.
To summarize, it’s usually a waste of time for investors to worry about margin debt levels. For the most part, margin debt just follows the level of the market itself. If it is at record highs, that is probably because the market is at record highs. If your strategy is to never buy a market with a record amount of margin debt in it, then, effectively, your strategy is to never participate in secular bull markets. Not a very good long-term strategy.
There may be a relationship between how quickly margin debt increases relative to the market’s advance and the probability of subsequent corrections, but there are too many confounding variables and too many historical counter examples in the data for us to be confident about it. More importantly, we as investors are unlikely to be able to convert the relationship into an actionable investment strategy. The proof is in the data–margin debt and the change in margin debt show essentially zero correlation to future returns. One cannot build a simple, intuitive, non-data-snooped market timing strategy that outperforms using margin debt as the timing criterion. For every correction one avoids, one will miss even greater market advances. Regardless, the question doesn’t matter to present market conditions, since we’re not in a situation where margin debt is flagging anything unusual. It’s current trajectory is perfectly in-line with historical norms for a bull market.
With all of that said, we have to remember that the market is ultimately a Keynesian Beauty Contest. What matters is not what is actually the case, but what market participants believe (or will eventually believe) is the case, and how they choose (or will eventually choose) to act on that thinking. In the United States, the experience of 1929 has ingrained the dangers of excessive margin borrowing into the market’s moral ethos. Consequently, “too much margin” has become a story that investors instinctively tell to explain why the market falls (usually after the fact). The story was told in the 2000s, in the 1990s, in the 1980s, in the 1970s, in the 1960s, as far back as you look. For the most part, it’s not true. But it doesn’t necessarily need to be true to matter; sometimes, it just needs to be believed by enough people. And so if the chart of margin debt starts to do funky things that genuinely scare the investment community (we’re not there yet), we will need to at least pay attention, because that narrative, even if wrong fundamentally, can affect behavior, and can therefore become true reflexively.