In this piece, I’m going to derive and explain the Kalecki-Levy Corporate Profit equation, and then demonstrate its truth empirically using data collected by the BEA. I’m then going to present tables that show the values of the components of the equation, as a percentage of GNP, from 1929-2012 annually, with recessionary periods shaded in. I’m going to conclude with a brief comment on mean reversion.
Profit Equation Derived and Explained
Let’s define some terms.
- Saving means increasing one’s wealth. (And dissaving means depleting it).
- Hoarding means accumulating already-existing wealth.
- Investment means creating new wealth that didn’t previously exist.
- Wealth can mean whatever you want it to mean, as long as the definition is applied consistently, and on a net basis. Usually, when we speak of wealth, we mean things that are of economic value to human beings, to include both real and financial assets. One’s wealth is constituted by the real and financial assets that one owns, net of one’s liabilities.
Individuals within an economy can save by hoarding, or by investing. Suppose that I earned $100 last year and put all of it into a piggy bank. Over the period, I’ve increased my wealth–saved–by hoarding, by accumulating money that already existed. Now, suppose that instead of putting the $100 into a piggy bank, I use it to pay for the construction of a new home for myself. In this case, I’ve increased my wealth–saved–by investing. I’ve created a new source of wealth–shelter–that didn’t previously exist.
Hoarding is a zero sum game. To illustrate, suppose that you and I are the only people in the economy. You have $100, and I have $100. You take your $100 and give it to me as payment in exchange for cooking you a meal to eat. If I save the $100 by hoarding–by putting it into a piggy bank, I will be taking it out of circulation. It won’t be coming back to you. Thus, my saving of the money will necessarily come at the cost of your dissaving. My wealth will increase from $100 to $200, but only because your wealth decreased from $100 to $0 (what you ended up with after sending money to me and never getting it back).
Investment, in contrast, is a positive sum game. If I take the $100 that you paid me, and I pay it back to you in exchange for building me a new home, you will get the money back. Because I saved by investing, my saving will not require you to dissave. I will end up with increased wealth–my original $100 plus the home that was built–and you will up end where you started, with your original $100.
Because hoarding is a zero sum game, the overall economy–considered in aggregate–can only save by investing. What follows is a fundamental macroeconomic identity:
(1) Saving = Investment
This identity applies only to the overall economy. It doesn’t necessarily apply to individuals or entities inside the economy.
Now, let’s arbitrarily divide the economy into four aggregate entities: All U.S. Households, All U.S. Corporations, the U.S. Government at all levels (Federal, State, Local), and the Rest of the World (ROW).
Trivially, the saving of the overall economy is the saving of each of these entities. Thus,
(2) Saving = Household Saving + Corporate Saving + Government Saving + ROW Saving
Now, Corporate Saving is simply Corporate Profit (wealth accrued by corporations over a period) minus Dividends (wealth paid out to shareholders in that period). Thus,
(3) Corporate Saving = Corporate Profit – Dividends
Substituting (3) into (2), and (2) into (1), and rearranging, we get,
(4) Corporate Profit = Investment + Dividends – Household Saving – Government Saving – ROW Saving
This is the Kalecki-Levy profit equation, a macroeconomic accounting identity derived by Jerome Levy in 1908. What it says is that if dividends are held constant, then any increase in savings that the non-corporate sector conducts that is not offset by an increase in investment (from either the non-corporate or the corporate sector) will require the corporate sector to save less–i.e., increase it’s wealth less, have less profit. Note that governments save and dissave by running government surpluses and deficits, and that the ROW saves and dissaves by running trade surpluses and deficits, net of other transfers.
A few points of clarification:
- The Kalecki-Levy profit equation describes a required result. It doesn’t describe how the economy gets to that result. The variables that determine how much companies earn in profit are the same as they’ve always has been–revenue, expenses (depreciation, wages, interest, etc.), and taxes. These variables are the true drivers of changes in profits. However, when they change, terms in the equation change. So, for example, if the government eliminates the corporate tax, profits will jump. But the government will be losing revenue. To keeps its spending constant, it will have to dissave–increase its deficit. Now, if the government reduces its spending by the same amount as the lost taxes, so as to keep its deficit unchanged, the corporate sector will lose that amount in revenue. And so the entire process will end up being a wash for profit–what the corporate sector gains in lower taxes, it will lose in lower revenue.
- Borrowing doesn’t imply dissaving. You can borrow to invest–for example, to build a home. In that case, your wealth stays constant. You take on a debt, but you receive an asset in exchange for it. The kind of borrowing that involves dissaving is borrowing to consume. When you borrow to consume, you take on a debt, but end up with nothing to show for it–and thus you deplete your wealth.
- Investing doesn’t mean trading already-existing securities such as stocks and bonds. It means the creation of new wealth that didn’t previously exist. Define “wealth” however you wish–it doesn’t matter, as long as the definition is applied consistently. But to count as investment, the wealth must be new.
- Operationally, the Government is in a different place from the other sectors because it (normally) can create money directly. It therefore has an infinite capacity to borrow and dissave. More importantly, it doesn’t exist for the sake of its own wealth–it exists for the sake of the wealth of households. For this reason, in periods where the desire to save is high, and the desire to invest is low, it has an obligation to the other sectors to dissave by running deficits. Its dissaving prevents the economy from seizing up as everyone tries to hoard the same assets in a zero sum game. It can be helpful for the government to run smalls deficits even during prosperous times, to ensure that there is enough cushion in the system to allow other sectors to save. Other considerations aside, we all want to increase our wealth–and our prosperity–over time. The government exists, in part, to help support us in that effort.
Profit Equation Empirically Confirmed
The profit equation can be confirmed empirically using data from the National Income and Product Accounts (NIPA). It doesn’t need to be confirmed, because it’s true by definition. But confirming it can provide us with a second check, to make sure it’s right. The fact that it can be confirmed is a testament to the prowess of the Bureau of Economic Analysis (BEA)–that it would be able to gather data for a 300 million person economy with trillions of dollars in annual transactions, and that the results would fit together so closely in the final analysis.
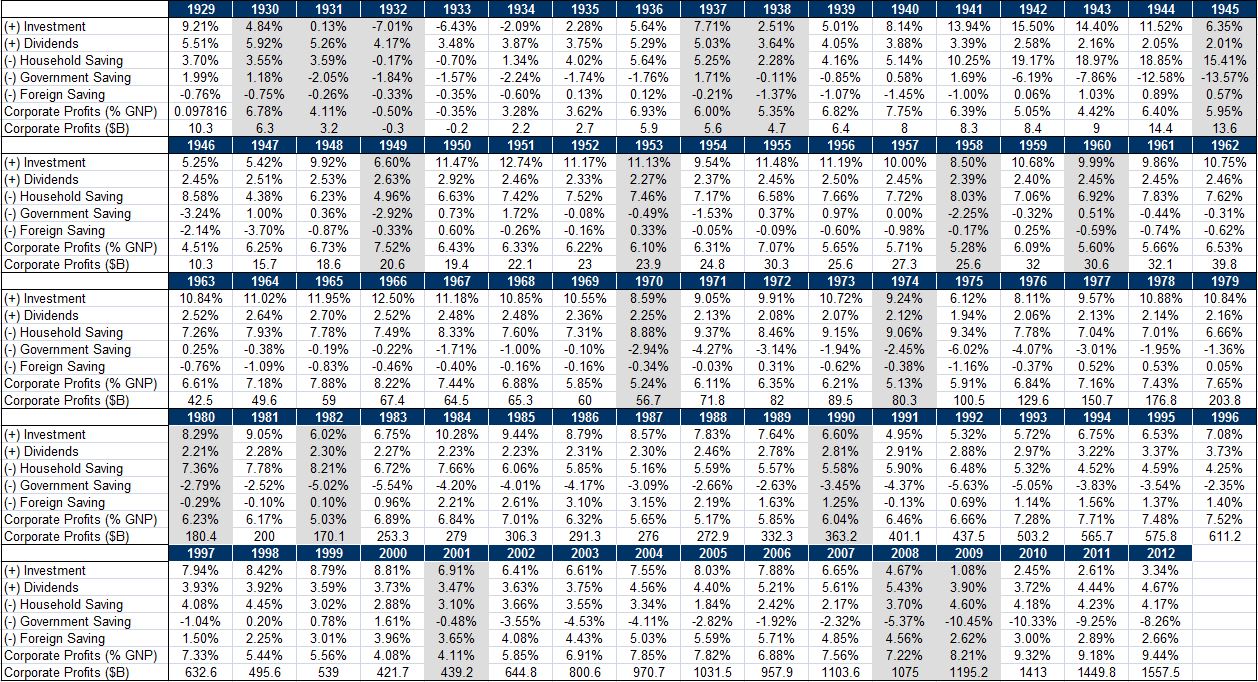
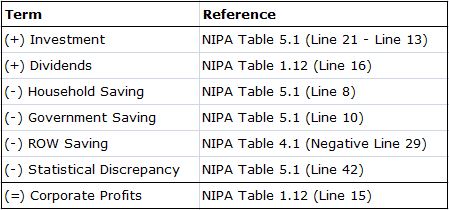
We’re going to take each saving and investment term net of depreciation (the wealth that is lost naturally over time as assets depreciate). We’re also going to use corporate profits after taxes. The following table gives the NIPA references for each of the terms, available on the BEA website:
To normalize, we divide each term by Gross National Product (GNP) (NIPA Table 1.7.5 Line 4). The reason that we use GNP rather than Gross Domestic Product (GDP) is to be consistent. GNP refers to the total production supplied by the labor and property of U.S. resident entities, whether the production takes place inside U.S. domestic borders, or abroad. GDP, in contrast, refers to the total production that occurs inside U.S. domestic borders, whether the production is supplied by the labor and property of U.S. resident entities, or of foreigners. The corporate profit term that we used was corporate profit for all U.S. corporations, regardless of where the profit was earned; that term feeds directly into GNP, not GDP.
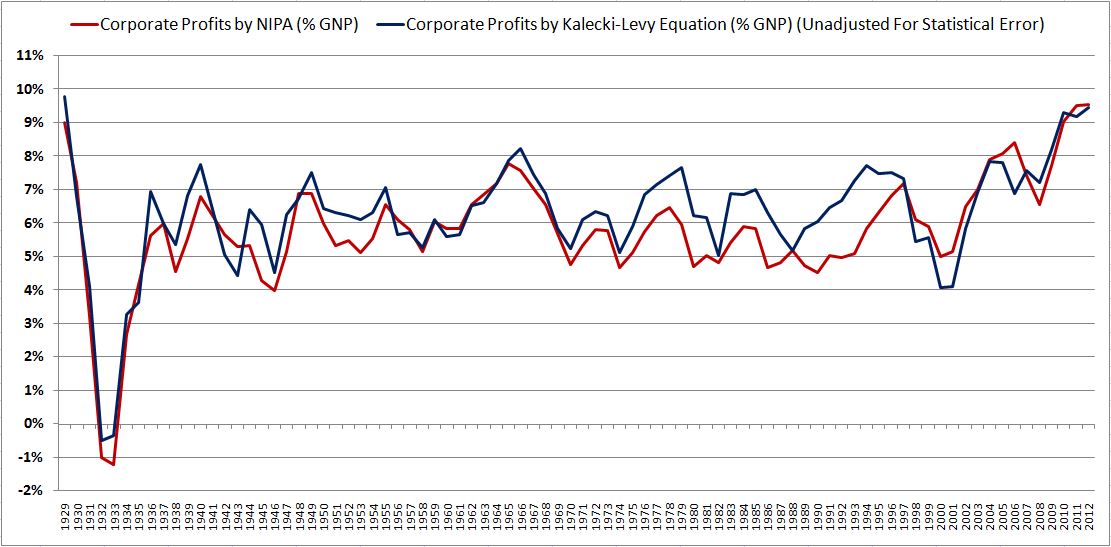
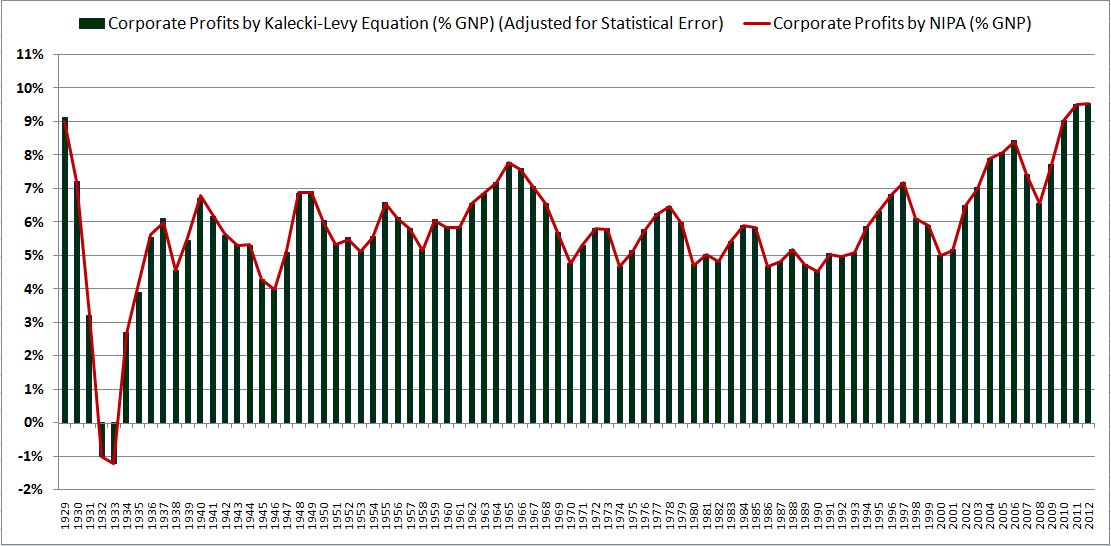
The following chart shows Corporate Profits as a percentage of GNP from 1929-2012, calculated using the Kalecki-Levy Equation and gathered directly by the BEA in NIPA.
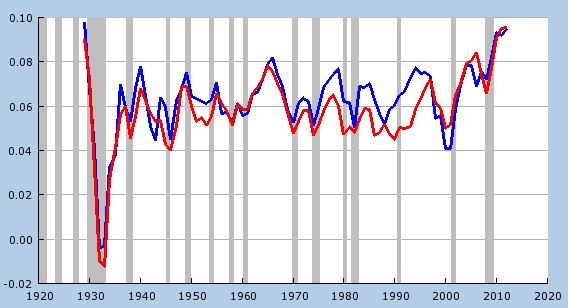
We can construct the same chart using terms available in FRED (click here for link).
NIPA Table 5.1, Savings and Investment, has a discrepancy term to account for errors in data gathering and statistical estimation. Unsurprisingly, when the discrepancy term is subtracted out of profit, the numbers match exactly.
A History of Corporate Profits, 1929 – 2013
The following table show the components of the corporate profit equation annually from 1929 to 2012, neglecting statistical discrepancy.