Mean-reversion in a system doesn’t happen simply for the sake of happening. It happens because forces in the system cause it to happen. With respect to profit margins, the following questions emerge: What are the forces that cause profit margins to mean-revert? Why do those forces pull profit margins towards any one specific mean value–11%, 9%, 7%, 5%, 3%, 1%–rather than any other? And why can’t secular economic changes–for example, changes in interest rates, corporate taxes, and labor costs–affect those forces in ways that sustainably shift the mean up or down?
In what follows, I’m going to explore these questions. I’m going to argue that profit margins are simply the wrong metric to focus on. The right metric to focus on, the metric that actually mean-reverts in theory and in practice, is return on equity (ROE). Right now, the return on equity of the U.S. corporate sector is not as elevated as the profit margin, a fact that has significant implications for debates about the appropriateness of the U.S. stock market’s current valuation.
The piece has three parts. In the first part, I critique profit margin mean-reversion arguments grounded in the Kalecki-Levy profit equation, put forth most notably by James Montier and John Hussman. In the second part, I challenge the claim that competition drives profit margin mean-reversion, and argue instead that competition drives mean-reversion in ROE. In the third part, I use NIPA and flow-of-funds data to quantify the current ROE of the U.S. corporate sector, and discuss how a potential mean-reversion would impact future equity returns.
Balance of Payments: The Kalecki-Levy Profit Equation
A common argument for the mean-reversion of profit margins involves an appeal to the balance of payments between different sectors of the economy. We can crudely summarize the appeal as follows. Assuming constant total income for the overall economy, the profit margin reflects the quantity of income that goes to the corporate sector. If that quantity rises, the quantity that goes to other sectors–households, the government, and the rest of the world–must fall. Trivially, if the quantity that goes to the other sectors falls, those sectors will have to reduce their expenditures. But their expenditures are the revenues of the corporate sector. All else equal, the revenues of the corporate sector will have to fall, in direct opposition to the profit margin increase.
James Montier and John Hussman state the argument in more precise terms by appealing to the Kalecki-Levy profit equation, which we derived and explained in a previous post:
(1) Corporate Profit = Investments + Dividends – Household Saving – Government Saving – Rest of the World (ROW) Saving
If you divide each of the terms in the equation by GNP, you get an equation for Profit/GNP, which is an approximation of the aggregate profit margin of the U.S. corporate sector. Thus,
(2) Profit/GNP = Investment/GNP + Dividends/GNP – Household Saving/GNP – Government Saving/GNP – ROW Saving/GNP
The equation expresses the intuitive point that if corporations hoard profit–that is, if they earn profit, and then hold it idle, rather than invest it back into the economy–they will suck the economy dry. The other sectors of the economy will lose income. To maintain constant expenditures and avert recession, those sectors will have to either: (1) lever up their balance sheets–that is, borrow funds and invest them–which will create new income for the economy to make up for the income that the corporate hoarding has pulled out of the economy, or (2) reduce their savings rates.
With the possible exception of the government, there’s an obvious limit to how much any given sector of the economy can lever up its balance sheet or reduce its savings rate. Likewise, there’s a limit to how much the corporate sector can realistically invest. There are only so many profitable ventures to invest in–to invest beyond what those ventures warrant would be to incur an effective loss. Citing the equation, Montier and Hussman therefore conclude that an upper limit exists on Profit/GNP.
But this conclusion misses what is arguably the most important term in the equation: the Dividend/GNP term. Profit/GNP can be as high as you want it to be, without any sector needing to increase its investment or reduce its savings rate, as long as the “leftover” profits are distributed back to shareholders in the form of dividends. And why wouldn’t they be? The purpose of a corporation is not to earn profit for the sake of earning profit, but for the sake of paying it out to its owners. Those owners are not going to tolerate a situation where cash sits idly on the corporate balance sheet, particularly if the stock is languishing. They will demand that the cash be invested in something productive, or paid out to them. Ultimately, they will get their way.
The Profit/GNP term is hovering near a record high right now. But so is the Dividend/GNP term. The following chart shows U.S. corporate profit (red) and U.S. corporate dividends (blue), both as a percentage of GNP, from 1947 to 2014 (FRED):
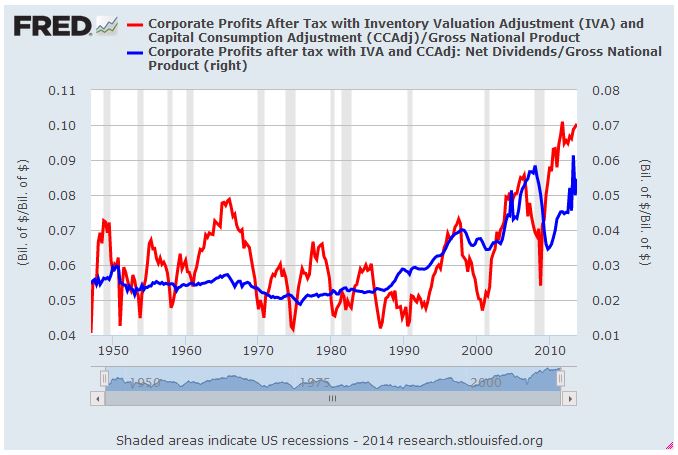
As you can see, the two terms have risen to record highs together. Relative to the historical average, the Profit/GNP term is elevated by around 383 bps. But of that amount, 252 bps is already accounted for in a higher Dividend/GNP term. To achieve an equilibrium at current Profit/GNP levels, then, all that is needed is an additional net 131 bps of reduced Saving/GNP from the other sectors of the economy. That’s a relatively modest amount–a small increase in the government deficit relative to the average could easily provide for it, and almost certainly will provide for it as baby boomers age over the next few decades.
So there really isn’t any problem here. Corporations will earn whatever amount of profit they earn. If they can’t find useful targets for reinvestment, they will distribute the profit as dividends (or buybacks–which get ignored here because of the way NIPA calculates “saving”), in which case the balance of payments condition set forth in the Kalecki-Levy equation will be satisfied.
Retained Corporate Profit Is Household Saving
It turns out that the application of the Kalecki-Levy profit equation to the profit margin debate is flawed in a much more fundamental way. The equation makes an arbitrary distinction between retained corporate profit and household saving. But households own the corporate sector, therefore retained corporate profit is household saving, in the fullest sense of the word “saving.”
In the current context, “saving” means “increasing your net wealth.” When corporations that you own increase their net wealth by retaining profit, your net wealth also increases, therefore you are “saving.” This saving is not some imaginary construct; it’s fully tangible and liquid, manifest in a rising stock market. You can monetize it at any moment by selling your equity holdings.
To be clear, in describing retained corporate profit as a type of household saving, I’m not referring to gimmicky, transient household wealth increases that might be accomplished by pumping up the stock market’s valuation. I’m talking about real, durable, lasting wealth increases that are backed by increases in corporate net worth and a larger implied streams of future dividend payments. Those are the kinds of wealth increases that indirectly accrue to households when corporations retain profits. The stock market doesn’t create them by rising in price; rather, it reflects them, makes them liquid for shareholders.
The wealth that corporations create for households can be retained and stored on the corporate balance sheet, in which case equities will sell for higher prices, leaving households with a larger reservoir of savings in the stock market that they can monetize, or the wealth can be paid out as dividends, in which case it will be stored in the bank accounts of the households directly. In the first case, households will “save”–accrue wealth–through increases in the market value of their equity holdings; in the second case, households will “save”–accrue wealth–through increases in the quoted values of their bank accounts. There’s no difference.
Now, for obvious practical reasons, the BEA chooses not to classify retained corporate profit and associated increases in the market value of equity holdings as a type of household saving. But it’s a real type of saving nonetheless, a type of saving that the Kalecki-Levy profit equation, in its present form, completely ignores.
The blue line in the following chart shows the household savings rate as a percentage of GNP from 1980 to 2014. The red line shows the housing savings rate as a percentage of GNP adjusted to reflect the household share of retained corporate profits (FRED):
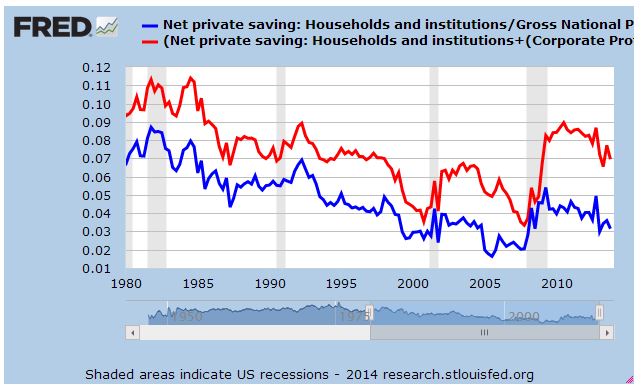
As you can see, the blue line is significantly below its average for the period. Since the mid 1980s, it’s fallen by more than 50%. The more accurate red line, in contrast, is only slightly below its average for the period. It’s actually on par with the level of the mid 1980s–a period generally considered to be economically “normal.” If, to maintain expenditures and avert recession in the presence of persistently high profit margins, households should need to reduce their savings rates, there’s plenty of room for them to do so–the current level is twice that of the cycle troughs of 2000 and 2007.
When you hear claims that record high corporate profits are coming at the cost of record low household savings, remember that the wealth in question is ultimately fungible. When it shifts from household “saving”, as defined in NIPA, to corporate profit, it’s not disappearing from the household balance sheet–rather, it’s going from one part of the household balance sheet (the bank account) to another part (the brokerage account). The Kalecki-Levy equation’s dichotomy between the two accounts, while helpful in some contexts, creates a distortion in this context.
A number of bullish Wall Street analysts have argued that high profit margins will likely persist because they’ve been driven, to a significant extent, by low interest rates, which are presumably here to stay. In an interview from a few months ago, James Montier responded to their argument:
“Low interest rates are another pretty good example of the framework, because ultimately those interest rates would have to be paid to somebody. It’s generally the household sector that benefits from higher interest rates. What that really means is that household savings have to be altered, because household income is less than it would be if you had high interest rates. The household-savings element of the Kalecki equation is where low interest-rate effect shows up.”
This point misses the fact that what households are losing in the form of lower interest income, they’re gaining in the form of higher dividends and higher stock prices. Income is not being removed from the household sector; rather, it’s being transferred from the cash and bond portions of household portfolios to the equity portions of those portfolios. The Kalecki-Levy equation, as constructed, ignores stock market appreciation as a form of household saving, therefore it doesn’t register the transfer. But the transfer is real, and 100% sustainable from a balance of payments perspective.
The Obvious Problem: Wealth Inequality
Low interest rates have helped drive a shift from household interest income to corporate profit. That shift is sustainable because the same upper-class households that own the majority of the cash and credit assets in the U.S. economy, and that would receive the interest payments that corporations would otherwise pay on accumulated debt, also own the majority of the U.S. economy’s equity assets. All that low interest rates do, then, is take income out of one part of their portfolios, and insert it in another part.
Now, a more powerful driver of increased corporate profitability has been the shift in income from wages–primarily those of the middle and lower classes–to profit. If the ownership of the corporate sector were distributed across all classes equally, the shift would not have much effect. What the middle and lower classes would lose in wages, they would gain in dividends and stock price appreciation. Unfortunately, the ownership of the corporate sector is not distributed equally–far from it. Right now, the top 20% of earners in the United States owns roughly 90% of all corporate equities. So when we talk about a shift from wages to profits, we’re talking about a shift in income and wealth from the 80% that needs more to the 20% that already has plenty.
This shift is obviously an ugly development for the larger society. But the question for investors isn’t whether it’s ugly–it is what it is. The question is whether it’s economically sustainable. Though it unquestionably reduces the natural growth rate, long-term financial stability, and aggregate prosperity of the U.S. economy relative to more progressive alternatives, it is economically sustainable.
One of the reasons that it’s economically sustainable is that it’s been coupled to a corresponding shift in expenditures. The bottom 80% earns a smaller share of overall income than it did in the past, but it also conducts a smaller share of overall spending. The simultaneous relative downshift in its income and spending has cushioned the implied blow to its savings rate. Similarly, the asset-heavy top 20% earns a larger share of overall income than it did in the past, but it also conducts a larger share of overall spending. The increase in its overall spending has helped to offset the otherwise recessionary implications of reduced relative spending from the bottom 80%.
The following table shows the consumption expenditure share of each income quintile for 1972 and 2011, with data taken from the census bureau’s consumer expenditure survey:
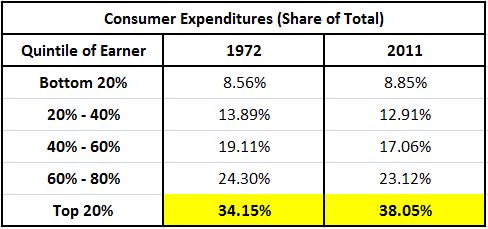
Since the early 1970s, we’ve seen a 3.90% shift in consumption expenditures from the bottom 80% to the top 20%. Not only have the rich come to represent a larger share of total income, they’ve also become bigger consumers of the overall pie. Likewise, just as the middle and lower classes have come to represent a smaller share of total income, they’ve become smaller consumers of the overall pie. Again, an ugly development, but a theoretically sustainable one nonetheless.
Roughly 40% of the U.S. consumption economy is driven by the consumption activities of the top quintile. That quintile consumes twice its population share–a huge amount. Its elevated consumption is critical in offsetting the depressed consumption of the other quintiles, especially the bottom two quintiles, which together consume half their population share.
Now, a spending reduction on the part of the bottom 80% equal to 3.90% of the total may sound like a small amount, and it is. But so is the corporate profit increase relative to the average–it’s also a small amount, 3.71% of total national income. Corporate profit is a very thin slice of the economy. Small changes in it as a percentage of GNP can have a big effect on the stock market and on the behaviors of corporations and investors. But the effect on the economy as a whole, in terms of the balance of payments of the various sectors (what the Kalecki-Levy equation is ultimately trying to get at), is exaggerated.
If, as income shifts from the bottom 80% to the top 20%, the spending of the top 20% fails to increase, then the bottom 80% will simply have to reduce its savings rate. Either that, or aggregate expenditures will drop, and the economy will fall into recession (assuming no government help). In practice, the bottom 80% has proven that it’s very willing to reduce its savings rate in order to avoid forced reductions in its consumption. It wants to keep consuming.
It may not be desirable for the bottom 80% to save less, but that doesn’t mean that it’s “unsustainable.” There’s no rule that says that households have to save, i.e., increase their wealth, by any specific amount each year. In theory, the fact that households aren’t reducing their wealth–that their savings rate is positive in the first place–is enough to make the situation sustainable (if they were reducing their wealth each year, they would be on a path to bankruptcy; that obviously can’t be sustained).
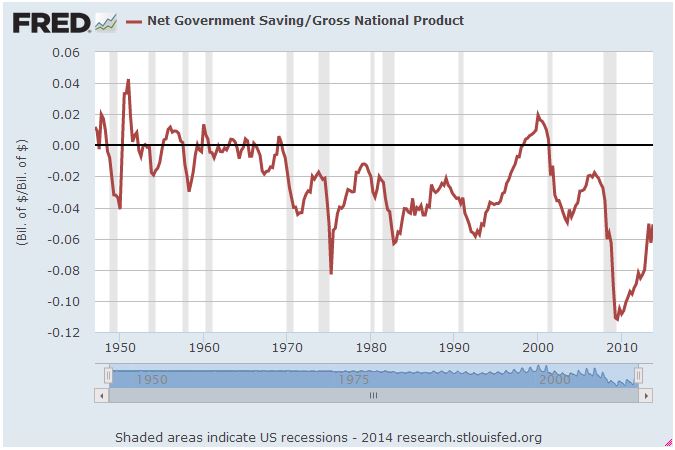
The U.S. economy recently conducted a “household saving” experiment in real time. In 2012 and 2013, it embarked on a grossly misguided fiscal austerity program that took income out of the pockets of the bottom 80% and put it into the black hole of increased government saving. If households had insisted on maintaining their savings rates amid the lost income, they would have had to have reduced their expenditures. Revenues, profit margins, and profits would have been pulled down, and the economy would have slipped into recession. That was the outcome that many people, myself included, were expecting. But it didn’t happen. Households simply reduced their savings rates to make up for the portion of lost income that other income sources–specifically, rising corporate and residential investment–failed to provide. Here we are, a year and a half later, with the government deficit roughly half what it was at the peak, and yet profit margins continue to snub their noses at the Kalecki-Levy equation, making new record highs as recently as this last quarter.
Competition as a Driver of Mean-Reversion
Another common argument for the mean-reversion of profit margins involves an appeal to competition. On this logic, profit margins cannot sustainably rise to elevated levels because corporations will undercut each other on price to compete for them. The undercutting will drive profit margins back down to normal.
But if corporations are inclined to undercut each other on price when profit margins are “elevated”, so that profit margins fall to “normal”, why wouldn’t they be inclined to undercut each other on price when profit margins are “normal”, so that profit margins fall to “depressed”? And why wouldn’t they be inclined to undercut each other on price when profit margins are “depressed”, so that profit margins fall to zero? Why would the process of price undercutting stop anywhere other than zero, the terminal point of competition, below which there’s no worthwhile margin left to take?
If a competitor’s 11% profit margin is worth pursuing, why wouldn’t that competitors 9% profit margin also be worth pursuing? And the competitor’s 7% profit margin? And the competitor’s 5% profit margin? And the competitor’s 3% profit margin? It’s all profit, right? Why would a corporation leave any of it on the table for someone else to have, when the corporation could go in and try to take it?
On this flawed way of thinking, there’s no reason for the margin-depressing effects of competition to stop at any specific profit margin number; corporations should cannibalize each other down to the bone. They should try to take every meaningful amount of competitor sales volume that is there to be taken. Profit margins in unprotected industries should therefore be something very close to zero. But, in practice, profit margins in unprotected industries are not close to zero. Why not?
Corporations seek to maximize their total profits–not their profit margins, not their sales volumes. They sell their output at whatever price produces the [profit margin, sales volume] combination that achieves the highest total profit. In environments where there is significant excess capacity and weak demand, that combination usually entails a low price relative to cost, i.e., a low profit margin. Corporations aggressively undercut each other to sell their output. In environments where there is tight capacity and strong demand, the combination usually entails a high price relative to cost, i.e., a high profit margin. Corporations don’t have to undercut each to sell their output–so they don’t. They do the opposite–they’ll overcut each other, raise prices.
The mistake we’re making here is to assume that corporations “compete” for profit margins. They don’t. Profit margins have no value at all. What has value is a return. The decision to expand into the market of a competitor and seek additional return is not a decision driven by the expected profit margin, the expected return relative to the anticipated quantity of sales. Rather, it’s a decision driven instead by the expected ROE, the expected return relative to the amount of capital that will have to be invested, put at risk, in order to earn it.
Suppose that you run a business. There is another business across town similar to your own whose market you could penetrate into. If operations in that market would come at a high profit margin, but a low return on equity–i.e., a low return relative to the amount of capital you would have to invest in order to expand into it–would the venture be worth it? Obviously not, regardless of how high the profit margin happened to be. Conversely, suppose that the return on equity–the return on the amount of capital that you would have to invest in order to expand into the new market–would be high, but the profit margin would be low. Would the venture be worth it? Absolutely. The profit margin would be irrelevant–you wouldn’t care whether it was high or low. What would attract you is the high ROE, the fact that your return would be large relative to the amount of capital you would have to deploy, put at risk, in order to earn it.
In a capitalist economy, what mean-reverts is not the profit margin, but the ROE, adjusted for risk. The ROE in an adequately-supplied sector cannot remain excessively high because investors and corporations–who seek returns on their capital–will flock to make new investments in it. The new investments will create excess capacity relative to demand that will provoke competition, weaken pricing power, and drive the elevated ROE back down. Likewise, the ROE in an adequately-demanded sector cannot remain excessively low because investors and corporations will refrain from making new investments in it. In time, the sector’s capital stock will depreciate. The existing productive capacity will fall, and a supply shortage will ensue that will give the remaining players–who still have capacity–increased pricing power and the ability to earn higher profits. The ROE will thus get pushed back up, provided, of course, that what is being produced is still wanted by the economy.
Not only does the increased investment that abnormally high ROEs provoke lead to increased capacity and increased competition, it also leads to increased wage pressure and increased interest rates, both of which hit the corporate bottom line and pull down the corporate ROE, all else equal. The same is true in the other direction–the depressed investment that inappropriately low ROEs provoke leads to downward wage pressure and falling interest rates, both of which boost the corporate bottom line and increase the corporate ROE, all else equal. The “all else equal” here obviously requires an appropriate monetary policy and the existence of automatic fiscal stabilizers–those have to respond to maintain aggregate demand on target, otherwise the situation will spiral into an inflationary boom or a deflationary recession.
At the open, we posed the question: why can’t the natural mean for profit margins change in response to secular changes in the economy–changes, for example, in corporate tax rates, interest rates, labor costs, etc.? There is no answer, because the thesis of profit margin mean-reversion is not a coherent thesis. But for ROEs, there is an answer. The answer is that investors and corporations do not distinguish between the causes of high returns. As long as high returns are expected to be sustained, investors and corporations will seek them out in the form of new investment, whether the underlying causes happen to be low taxes, low interest rates, low labor costs, or any other factor. The elevated ROEs will therefore get pulled back down, regardless of their explanatory origins.
The only force that can sustainably cause ROEs to increase for the long-term is an increase in the risk-premium placed on investment. By “investment”, we mean the building of new assets, new physical and intellectual property–new stores, new factories, new technologies–not the trading of existing assets. Psychological, cultural and fundamental conditions have to shift in ways that cause capital allocators to get pickier, stingier, more cautious when it comes to investment, so that higher prospective returns become necessary to lure them in. If such a shift occurs, the competitive process will have no choice but to equilibriate at a higher ROE.
Right now, there is a sense that the aging, mature, highly-advanced U.S. economy, whose low hanging productivity fruits have already been plucked, and whose households are weighed down by the heavy burdens of private debt, is locked in a permanent slow-growth funk. When coupled to the traumatic experience of the financial crisis, that sense has dampened the appetite of capital allocators to make new investments. The perception is that the returns to new investment will not be attractive, even though the existing corporate players in the U.S. economy–the targets of potential competition–are doing quite well.
Additionally, an increasingly active and powerful shareholder base is putting increased pressure on corporate managers not to invest, and to recycle capital into dividends and buybacks instead, given that capital recycling tends to produce better near-term returns than investment. The data suggests that from a long-term perspective, shareholders are not entirely wrong to have this preference. Historically, a large chunk of corporate investment has been unprofitable, an unnecessary form of “leakage” from capital to labor. For that reason, corporations that have focused on recycling their capital have generally produced better long-term returns for shareholders than corporations that have opted to frequently and heavily reinvest it.
For these reasons, it’s been harder than normal for presently elevated ROEs to get pulled back down. If these conditions–investor hesitation and a preference for capital recycling over investment–last forever, then ROEs might stay historically elevated forever. Let’s hope the condition doesn’t last forever.
To return to the issue of profit margins, in practice, profit margins and ROE are reasonably well-correlated. That’s what creates the perception that profit margins mean-revert. But, in actuality, profit margins do not mean-revert, not out of their own accord. The variable that mean-reverts out of its own accord, in both theory and practice, is ROE. If the profit margin and the ROE are saying different things about corporate profitability, as they are right now, the ROE is what should be trusted.
Measuring the ROE of the Corporate Sector
To measure the aggregate corporate ROE, we take the profit of all national U.S. corporations (CPATAX: NIPA Table 1.12 Line 15, which includes foreign and domestic profit), adjust that profit to reflect its non-financial share, and then divide the result by the net worth of those same corporations measured at replacement cost (Z.1 Flow of Funds B.102 Line 33, which appropriately includes foreign assets in the calculation). The following chart shows the metric from 1951 to 2014 (FRED):
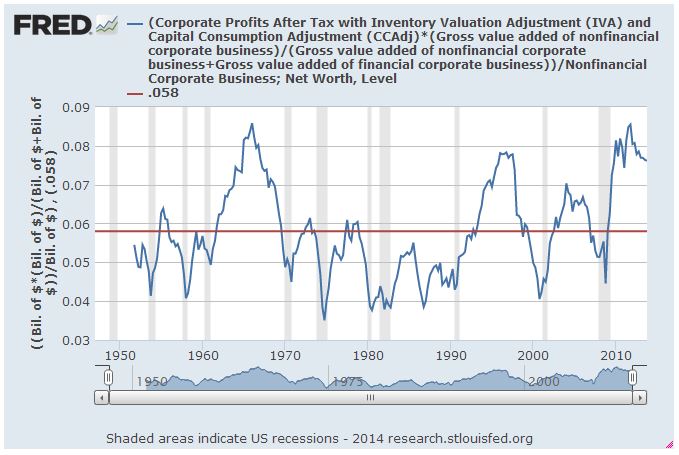
Right now, the corporate ROE is 31.2% above its historical mean–elevated, but nowhere near the 60% to 70% elevation that the bogus profit margin metric “CPATAX/GDP” was previously conveying.
The following table presents a running tally of all of the profitability metrics that we’ve examined so far.
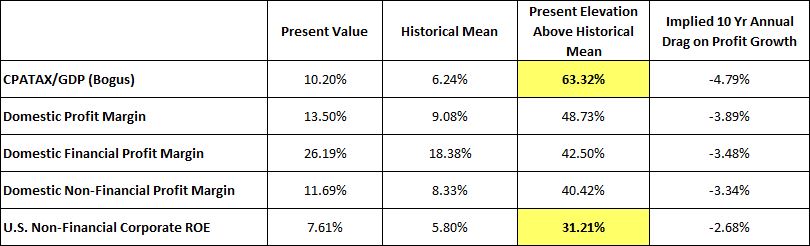
As you can see, the reduction in elevation has been significant. We started out with a deeply flawed metric that was telling us that corporate profitability was 63% above its mean. By making a series of careful, intuitively-sound, uncontroversial distinctions, we’ve managed to cut that number in half. Some have expressed concern with our singular focus on “domestic profitability”, given that abnormally high foreign profit margins may be a significant factor driving the overall increase profit margins. But the ROE metric presented here includes the ROE associated with foreign profits, so those concerns no longer apply.
If we want to look at purely domestic returns on capital, we can use domestic fixed asset data from the BEA. NIPA Fixed Asset Table 6.1 Line 4 gives the total value of all fixed assets of domestic non-financial corporations, measured at replacement cost. This is actually the series off of which “consumption of fixed capital” in the NIPA profit series is calculated. Dividing domestic non-financial profit (NIPA Table 1.14 Line 29) by domestic non-financial fixed assets, we get a reasonable approximation of the domestic non-financial ROA–return on assets:
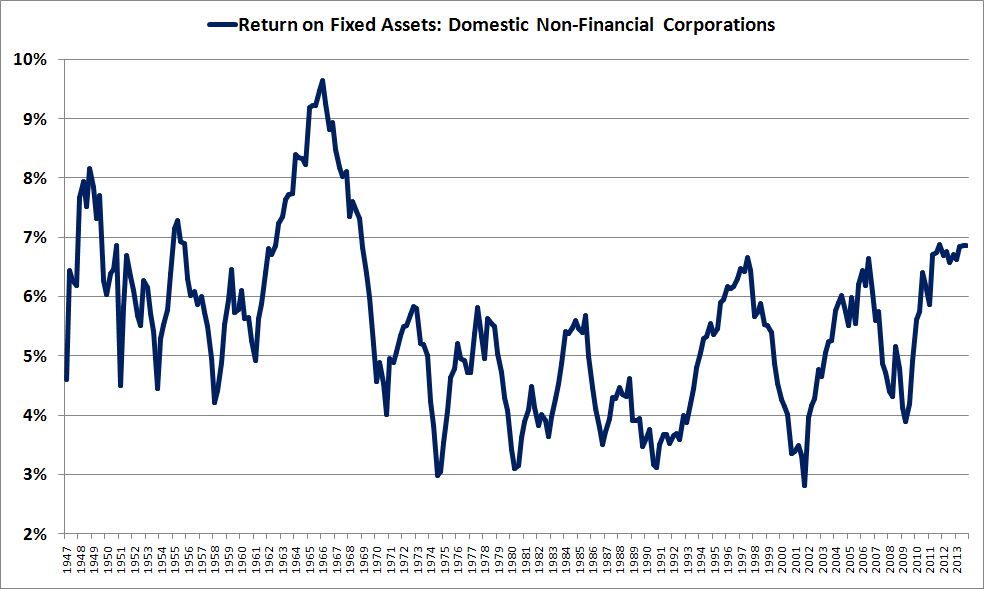
This measure is even less historically elevated than the U.S. corporate ROE–it’s only 24% above its historically average. Domestic corporations clearly aren’t generating as much profit on their asset base as a superficial glance at the profit margin would suggest, which sheds doubt on the claim that “competitive arbitrage” is going to drive corporate profitability dramatically lower over the coming years. Will we see a retreat from current record levels of corporate profitability as the cycle matures? Probably. But not the 40% plunge that advocates of profit margin mean-reversion are calling for.
Implications for Future S&P 500 Returns
In an earlier piece, I conservatively estimated that the S&P 500, starting from a level of 1775, would produce a 10 year nominal annual total return of between 5% and 6% per year. The market is now at 1900. I’m certainly not going to recommend that anyone rush out and buy it up here; using my 5% to 6% estimate, it’s roughly where it should be at year end 2016. However, I will claim credit for warning valuation bears that they’ve been focusing on the wrong factors, that they should be focusing on monetary policy and the business cycle, not on the market’s perceived expensiveness, which participants will eventually anchor and acclimatize to.
Markets fall not because of “overvaluation”, but in response to unexpected, unsettling changes to the narrative, changes that negatively impact expectations about where prices are headed over the near and medium terms. Rather than worry about the nebulous, unanswerable question of what “fair value” is, investors should focus on getting those changes right, particularly as they relate to monetary policy and the business cycle; the rest will take care of itself.
It turns out that we can arrive at the same 5% to 6% 10 year annual return estimate by assuming that the corporate ROE will fully revert to its mean. At 1775, the S&P 500 P/E multiple would be around 16.5, a normal value. So there’s no need to model for any P/E multiple contraction. If a mean-reversion in ROE from 7.6% to 5.8% were spread across 10 years, the implied annual drag on profit growth would be 2.7%. If the normal nominal return is 8%–say, 3% for real book value per share growth after dilution, 3% for the shareholder yield, including buybacks, and 2% for inflation–then the return implied by a full reversion in the corporate ROE would be 8% minus 2.7% = 5.3%, roughly what we estimated via different methods.
A nominal equity return between 5% and 6% isn’t “attractive” per se, but it’s acceptable, particularly in an environment where nothing else is offering any return. The return will surely beat out the emaciated alternatives on display in fixed income markets, especially when properly adjusted to reflect tax preferences that only equities enjoy. Crucially, the current valuation isn’t so dangerously high that investors should be boycotting U.S. markets outright–and definitely not so high that they should be boycotting more attractively priced foreign markets, as some have done, on the false expectation of an impending downturn that restores “normalcy” to U.S. markets. Corrections and pullbacks? Absolutely. A dramatic market fall that finally clears 20 years of perceived valuation excess, causing pain around the world? No.
Now, I readily admit, all of the arguments that I’ve given for why we should focus on ROE instead of profit margins are just that–theoretical arguments. Valuation bears don’t have to accept them. But I’ve also provided a metric that clearly mean-reverts. If we want to measure mean-reversion mathematically, with ADF statistics, the ROE metric that I’ve offered is actually more mean-reverting than every iteration of the profit margin thus presented, as expected given its more intuitive connection to the competitive forces that drive mean-reversion.
When valuation bears say that CPATAX/GDP, or some other profit margin metric, is going to fall to its historical average, and stay there, they are effectively saying that my metric, the ROE of the U.S. non-financial corporate sector, is going to fall substantially below its historical average, and stay there. Why should that happen? Why should competitive forces drive the ROE of the U.S. corporate sector permanently below its historical average, particularly in the present environment of corporate hesitation, where shareholders continue to forcefully demand dividends and buybacks in lieu of competition-stimulating new investment?