‘Tis the season for corrections, and so we ask, how often do they occur historically? To answer the question, we need to precisely define the the term “correction.” If the stock market falls 20% in a straight line, most of us would interpret the move to be a single 20% correction. But suppose that the stock market falls 10% in a straight line, then stabilizes or bounces, then falls another 10%. Would that be one correction, or two? We need to specify.
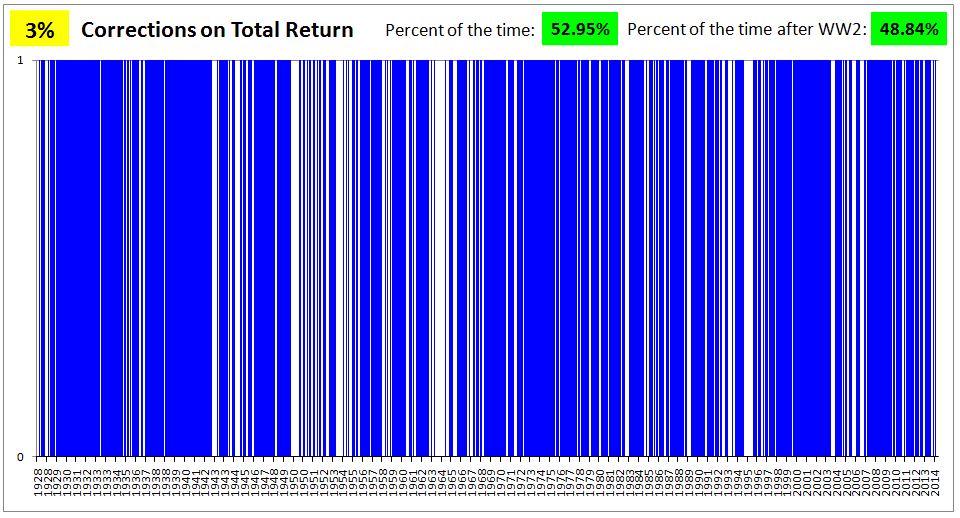
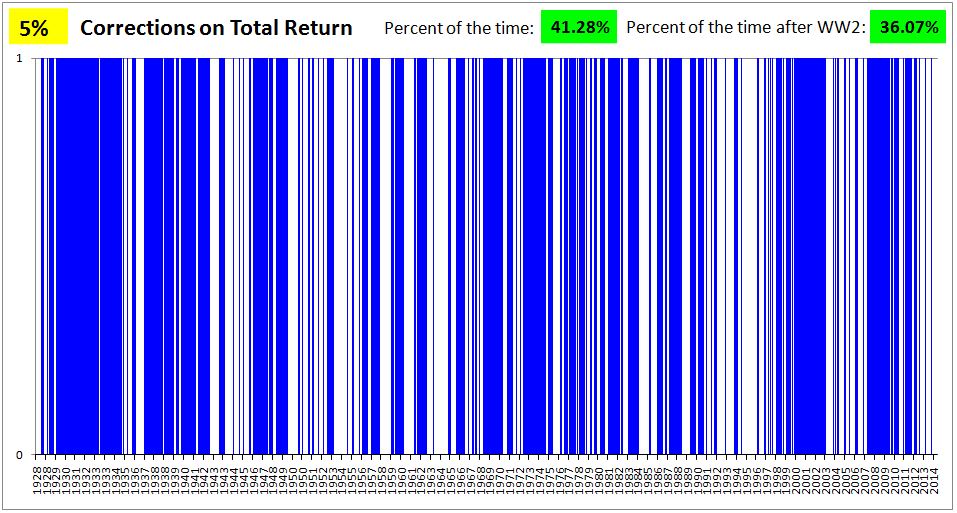
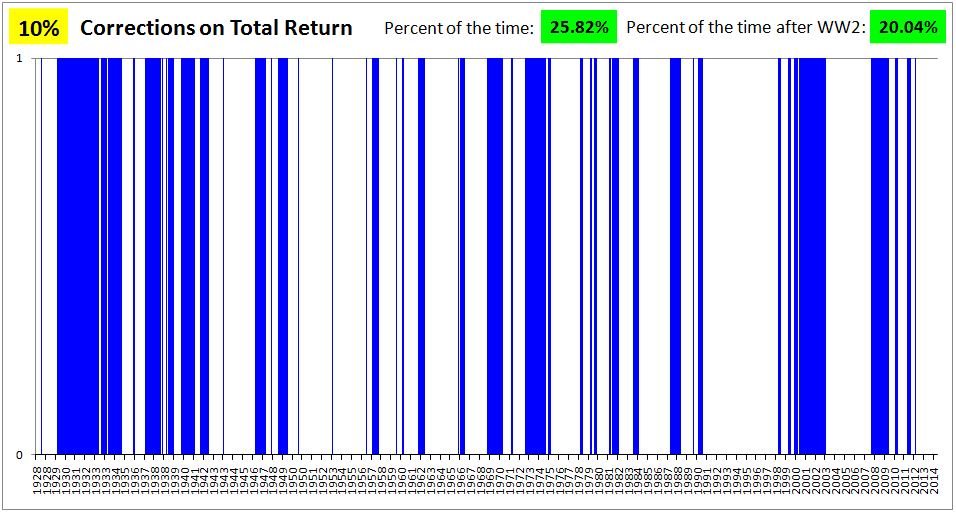
Here, we will arbitrarily define “correction” as follows. The market is in a correction of X% on a given day if it closes on that day at a level that is more than X% off of its closing 52 week high. The question we will then ask is, how often is the market in a correction of X%–3%, 5%, 7%, 10%, 15%, 20% and so on?
To answer the question, we will use a total return index (daily, built from CRSP data back to January 3rd, 1928), rather than a simple price index. The reason we will use a total return index is that in the past, companies paid out a much greater share of their earnings as dividends than they do in the present. But dividends, when paid out, represent step reductions in corporate net worth, and therefore entail step reductions in price. Dividends thus make it more likely that the market will hit an X% correction target on price, all else equal. By using a total return index rather than a price index, we eliminate this distortion.
We will analyze two different periods: a full period, from January 3rd, 1928 to August 28th, 2014 and a post-war period, from January 2nd, 1945 to August 28th, 2014.

Note that the term “correction”, as we’ve defined it, isn’t very helpful in depicting the larger moves, because those moves tend to happen over periods that exceed 52 weeks. In cases where the moves do exceed periods of 52 weeks, they often don’t get captured in the definition, because the previous 52 week high moves lower as the market moves lower, preventing the market from separating from it (falling relative to it) by the X% number.
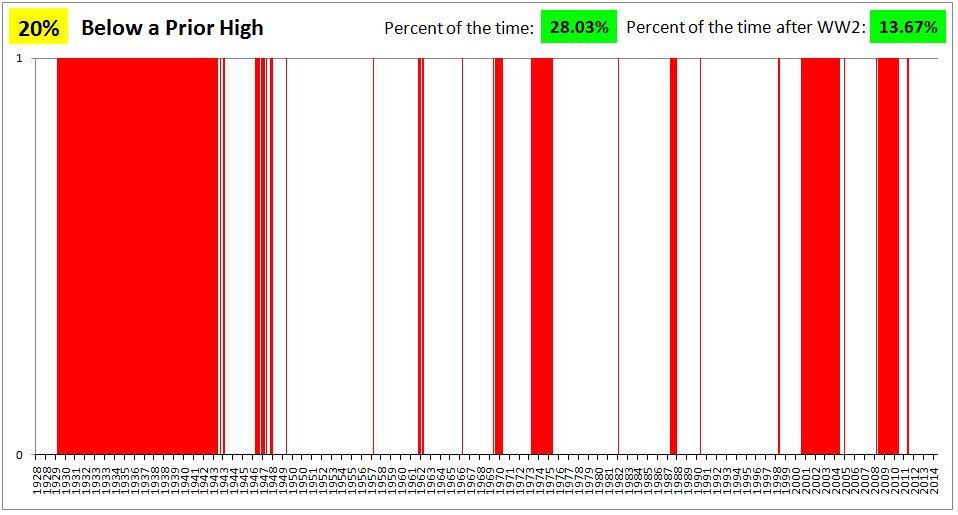
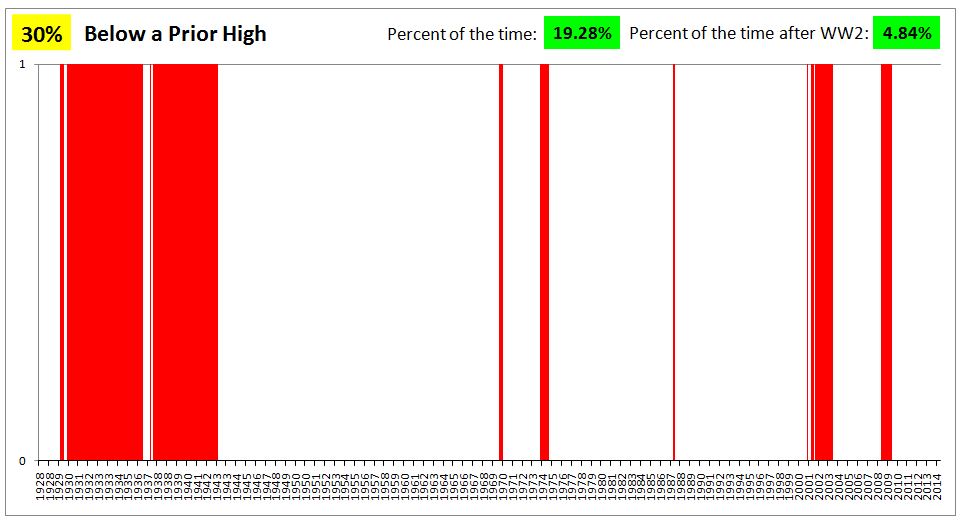
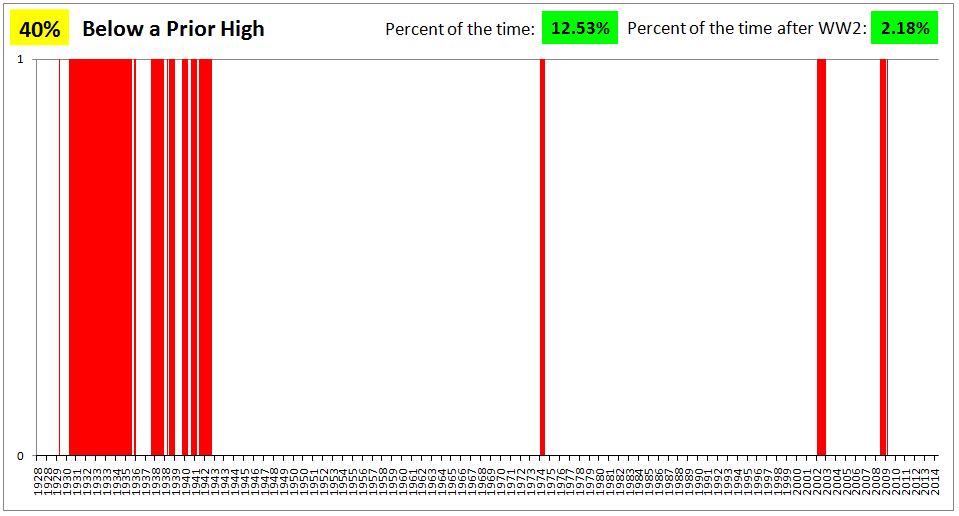
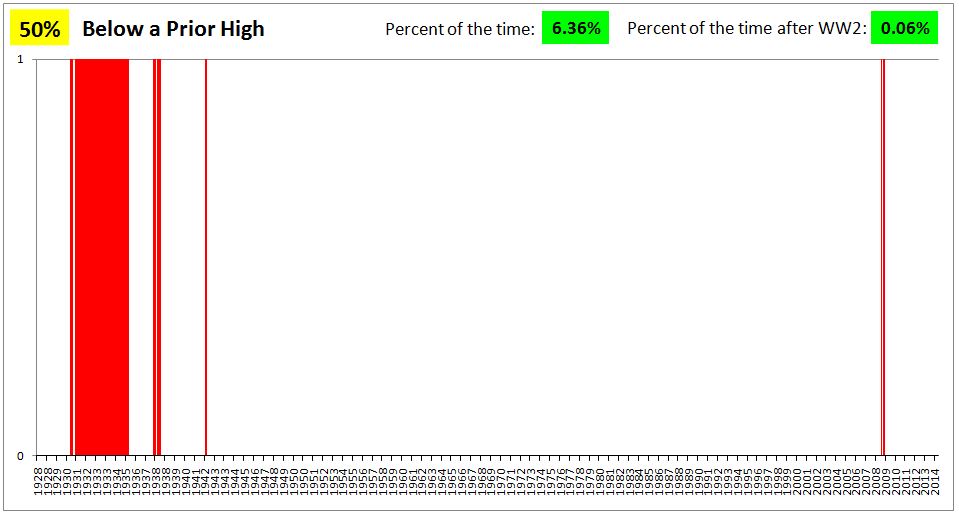
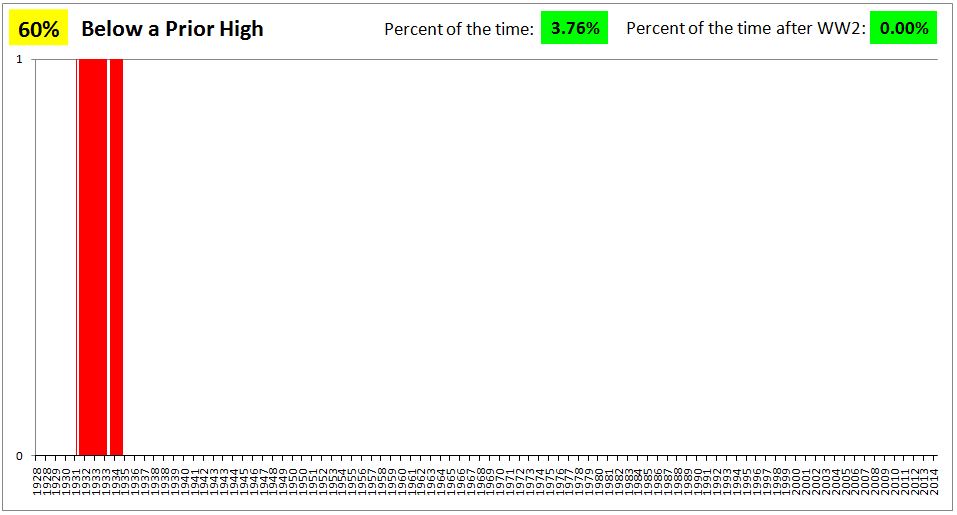
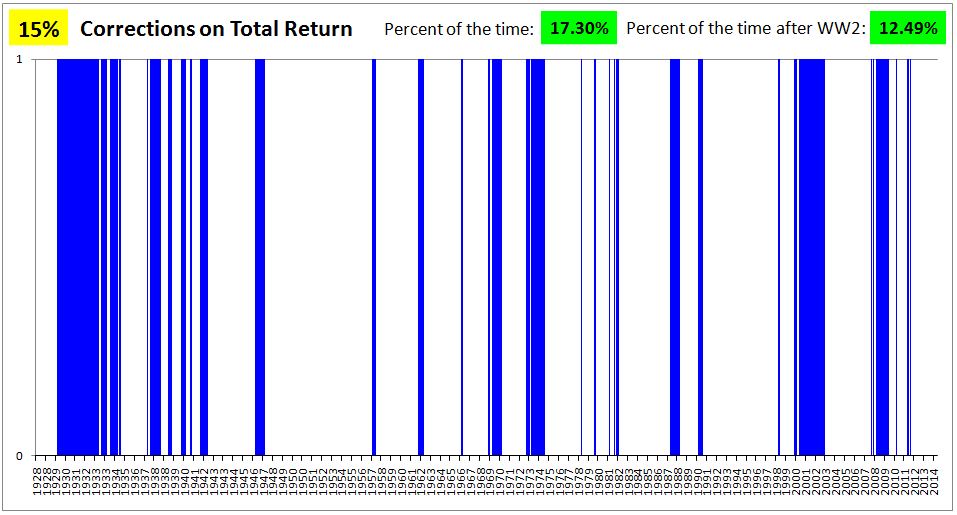
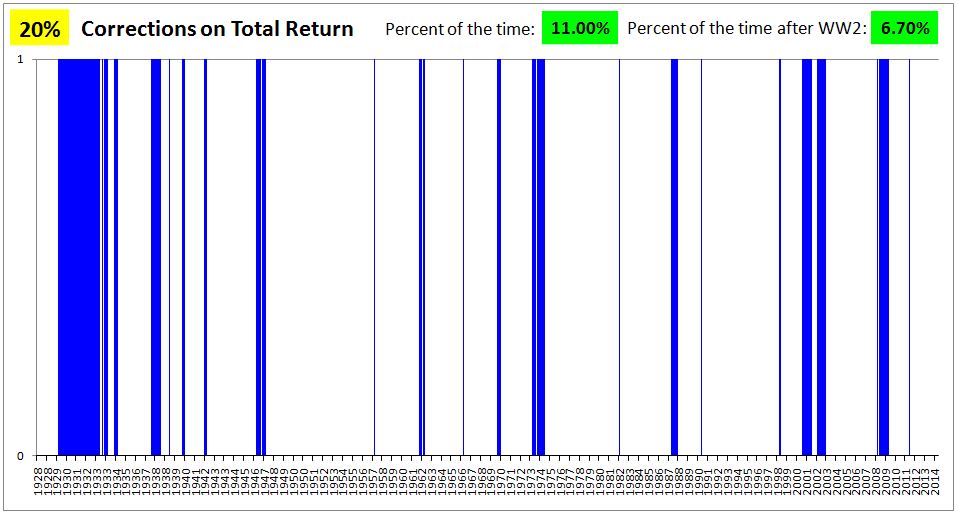
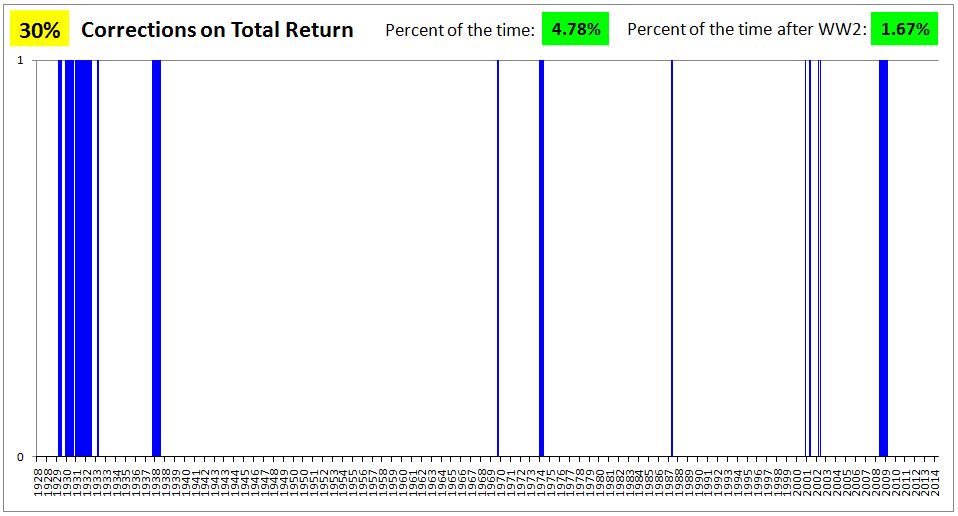
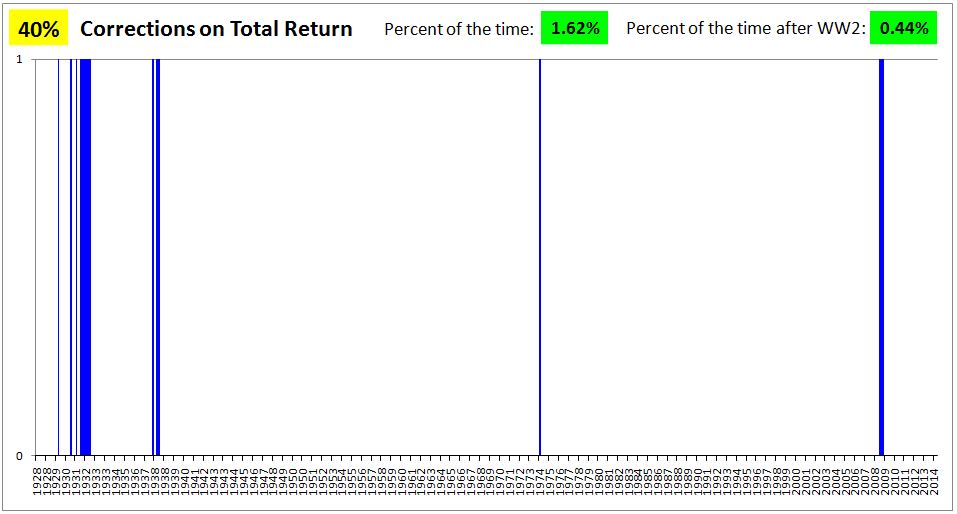
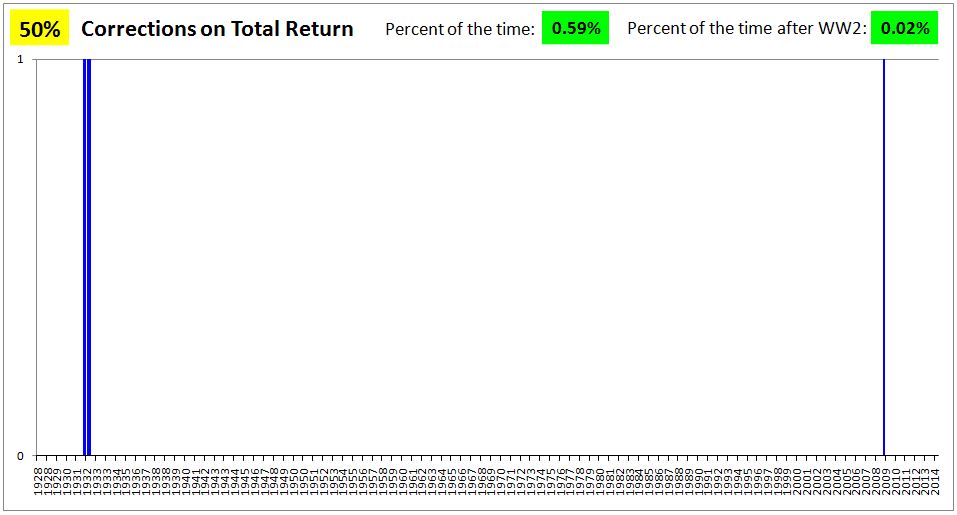
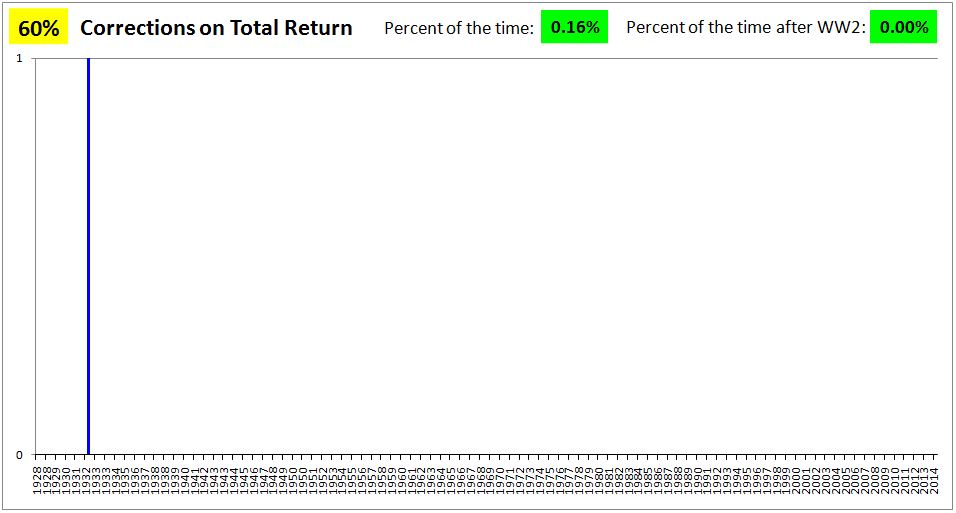
The following charts seek to provide a more useful depiction of the larger moves. They show all of those times where a buy and hold investor was down, on a total return basis, by more than X% from any prior all-time high.