Last week, CNBC profiled the inspirational story of Ronald Read, a gas station attendant and janitor from Vermont who amassed an $8MM fortune simply by investing portions of his small salary into high-quality, dividend-paying U.S. equities.
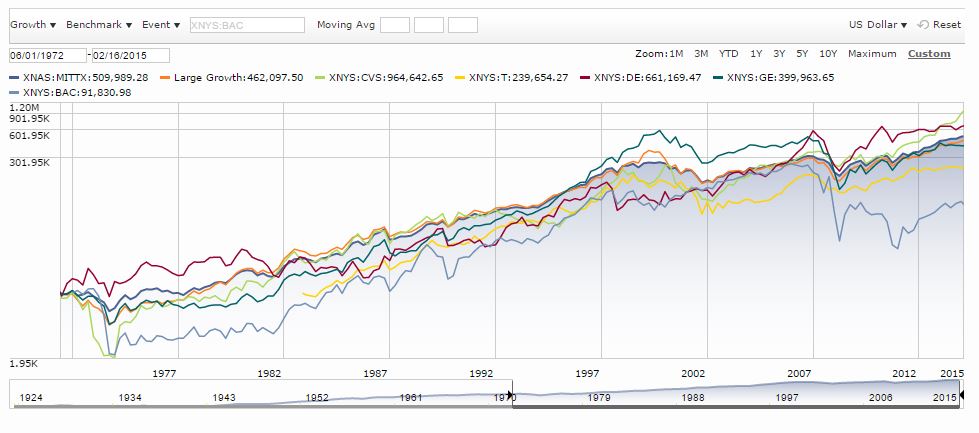
Judging from the familiar names that Read is reported to have owned–AT&T, Bank of America, CVS, Deere, GM, GE, and so on–alpha generation doesn’t appear to have been the main driver of his success (though it was probably a contributor). Over the last 40 years, those names have roughly tracked the large cap index, as you can see in the chart below.
The main driver of Read’s success appears to have been discipline: saving diligently and investing efficiently, and sticking with the process over a lifetime. That’s good news, because it means that anyone can potentially do what Read did. No special stockpicking talent is required.
Would it be possible for a present-day investor in Read’s employment circumstances to amass the fortune that Read amassed, if that investor were to apply Read’s discipline to a U.S. equity strategy? The actual numbers were crunched, and the surprising conclusion was yes.
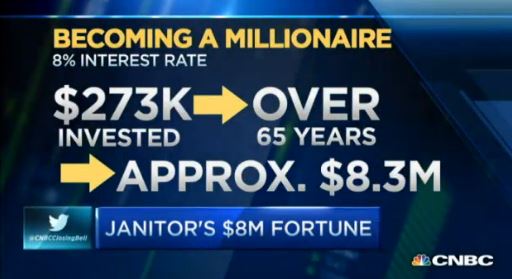
Per the analysis, if an investor wanted to amass an $8MM fortune, she would need to put around $300 per month into the market. Compounded at an 8% rate over 65 years, the ensuing investment pile would be worth around $8MM today. Now, $300 per month is a lot of money for someone working a minimum-wage job. But it’s not a prohibitive amount. $10 per hour times 40 hours per week times 4 weeks per month is $1600. On a pre-tax basis, $300 is roughly 20% of that amount.
But there’s a mistake in this analysis. It makes no adjustments for inflation. Sixty-five years ago, $300 per month was a very large amount of money–150% of the monthly wage of the average non-supervisory worker, which was itself almost double the federally legislated minimum wage. No janitor on earth would have been able to afford it.
Now, to be fair, the 8% return assumption used in the analysis might refer to a real, inflation-adjusted return, rather than a nominal return. If so, then the analysis is based on a return assumption that will almost certainly prove to be wrong. There have only been a few periods in U.S. history where a long-term buy-and-hold investor could have earned 8% after inflation. Needless to say, those periods–marked by widespread skepticism and obliviousness towards equities, and therefore extremely cheap equity valuations–had very little in common with the current market environment.
The following chart shows the annualized real total return of the S&P 500 for 65 year periods beginning in 1871 (endpoint 1936) and culminating in 1950 (endpoint today). All dividends are reinvested at market prices. The 1932 bear market low is circled in red for reference.
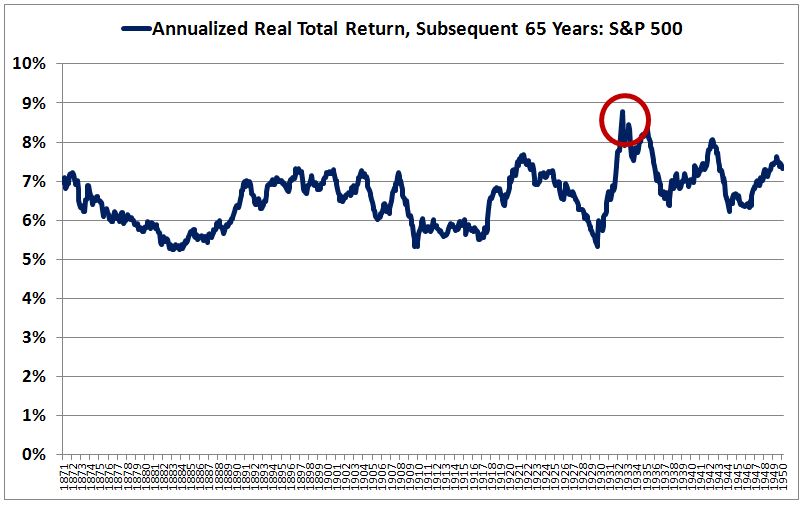
As you can see, the real total return only breached 8% on two occasions: first, during the troughs of the Great Depression (specifically, from April of 1932 into 1933, and then after the 20% correction that ended in September 1934, which took the index back to its January 1932 level), and second, during the selloff that occurred in the months after the Pearl Harbor attack (with a final bottom in April of 1942, which again took the index back to its January 1932 level). The market’s valuations at the lows of those periods, as measured by the Shiller P/E ratio, were 5.5 and 8.5 respectively, versus 27.2 today. Notably, in the case of the Great Depression, the return over the subsequent 65 year period was artificially boosted by the valuation extreme seen at the endpoint–1934 plus 65 years conveniently equals 1999 (party like it’s).
To get a better answer, let’s redo the analysis. How much would an investor have to put aside each month to have $8MM at the end of a long investment lifetime, one that begins today, say, at age 25, and that ends at Ronald Read’s final age of 92? Rather than apply an arbitrarily chosen annualized real return assumption (and then argue over whether the assumption will prove to be accurate going forward), we can just run the simulation directly, using the numbers that the market actually produced during Ronald Read’s investment lifetime.
What we’ll need to do, then, is calculate the amount, in 2015 dollars, that an investor would have had to have put into the S&P 500, each month starting in 1948, to end up with $8MM today. Comparing that amount to the current salaries of low-wage workers, we will be able to see whether or not the strategy is realistically affordable.
To have produced an investment pile worth $8MM today, on the assumption that all investments occur in a tax-sheltered account, with no transaction fees and no management fees, an investor would have had to have put aside $524 each month in 2015 dollars. $524 is a little over 30% of the gross monthly minimum wage. The investor would therefore have had to have found a way to live on a bit less than $1100 per month, before taxes. Such a frugal feat would have been extremely difficult to accomplish; in the typical real-life situation, where there are actual mouths to feed, it would have been impossible.
And note that taxes are not negligible here. Even if we assume a 0% income tax (netting out the income transfers that the worker would be eligible to receive), the combined 7.65% that the worker would have to pay in social security and medicare taxes (on the gross wage) would reduce the after-tax, after-investment monthly income to a number below $1000.
Of course, as we move up the income chain, the prospects get brighter. The average hourly wage for non-supervisory workers in the U.S. is around $21, more than double the federally legislated minimum wage. $21 per hour comes out to around $3400 per month. Taking out income and payroll taxes, and assuming no income transfers received, the after-tax income falls to around $2800. It’s reasonable to think that a determined worker could manage to take $524 out of that amount each month. And so even if the numbers don’t work out for janitors and gas attendants, they might still work out for average employees. The redemptive, feel-good conclusion that motivated the profile is therefore preserved: that Wall Street can, in fact, make average people, who have no special stockpicking talents, into multimillionaires.
But there’s another problem. In order for present investors to be able to earn the kinds of returns that would transform contributions of $524 a month into an $8MM sum over a 65 year period–the kinds of returns that the market actually saw from 1948 until today–the market will have to do that dirty thing that it did multiple times from 1948 until today, the thing that those of us who are invested in it pray for it not to do: CRASH.
It’s true that $524 per month invested in U.S. equities from 1948 to present would have produced an investment pile worth $8MM. But those monthly contributions, and the quarterly dividends earned along the way, would have been invested and reinvested into the market at the ultra-cheap valuations that the many crashes, corrections and bear markets seen from 1948 onward produced. Make no mistake: those valuation depressions were absolutely critical to the attractive returns that investors employing the strategy would have earned–and that Ronald Read did earn. Without them, the returns to the strategy would have been far less impressive.
Right now, we are not anywhere near the kinds of depressed valuations that helped to power the outsized returns of the post-war era, not even on measures that the most extreme of market optimists might otherwise embrace. And so, unless the market sees meaningful downside (or long, frustrating water-treading) in the years ahead, downside (or water-treading) that makes stocks genuinely cheap again, investors employing Read’s discipline should not expect to achieve his lucrative outcome.
What if stocks from 1948 to 2015 had never crashed, never corrected, never entered ugly bear markets that depressed their valuations? What if their valuations had instead always equaled today’s valuation, 27.2 on the Shiller P/E? How much would an investor’s monthly contributions have had to have increased, to have produced the same $8MM in the final tally? It turns out that we can give an exact answer to this question.
We know what the S&P 500’s earnings were at each point in time from 1948 to 2015. We can therefore calculate what its prices would have been at all times during the period if its valuation had stayed constant at today’s level, a Shiller P/E equal to 27.2. We can then calculate what size of contribution would have been required to produce the same $8MM investment pile, assuming that the contributions had been invested, and the dividends reinvested, at those hypothetical prices.
The following chart shows the actual S&P 500 price index alongside a hypothetical price index which postulates a Shiller P/E ratio that always equals the current value–27.2. Note that the y-axis is log scale, and all prices are nominal.

As stated earlier, to end up with $8MM by making regular investment contributions (and reinvesting dividends) into the blue line (the actual S&P 500 over the period), an investor would need to commit $524 (in 2015 dollars) per month. To end up with the same fortune by making regular investment contributions (and reinvesting dividends) into the red line (the hypothetical S&P 500 that never crashes, whose valuation is always equal to today’s valuation, a Shiller P/E of 27.2) an investor would need to commit $1831 per month–almost four times the earlier amount!
The average non-supervisory worker, who makes $2800 per month after tax, cannot afford to plow $1831–65% of her net income–into the stock market. And so unless stock valuations are going to retreat markedly from current levels (or spend very long periods of time going nowhere), investors shouldn’t expect to be hearing about Ronald Read stories in the next go-round.
Now, the Shiller P/E might not be the best way to measure valuations in the current market. But even on valuation measures that are more generous, the simulation still points to a substantial increase in the required contribution. Per S&P Capital IQ, the current trailing twelve month P/E ratio on operating earnings is around 18.5. To have generated $8MM from a market that always held at that valuation, an investor that started in 1948 would have had to have contributed $1005 per month–roughly double the earlier amount. And note that in using a one year earnings measure to gauge valuation, we are implicitly assuming that profit margins over the next 65 years will average out to their current record-high levels–possible, but a very risky assumption to make.
In all likelihood, present and future valuations will prove to be more important to returns over the next 65 years than they were to returns over the last 65 years. The reason why is that the growth of the population is set to slow, with the average age set to increase significantly. Slowing population growth and a significant upward shift in the average age, towards the elderly, implies reduced aggregate demand growth, and therefore a reduced need for expansive corporate investment. Corporations, if they want to do well for their shareholders, will therefore have to shift their capital allocation strategies away from traditional capital expenditures towards what might be perjoratively described as “capital recycling”–the payment of dividends (which get reinvested into the market) and the conduct of share buybacks (which are essentially identical to reinvested dividends in terms of their effect on total return). But the rate of return that dividends (reinvested at market prices) and share buybacks (repurchased at market prices) produce is strongly dependent on the valuations at which the reinvestments and repurchases occur. It follows that as the corporate sector shifts towards capital recycling as an allocation strategy (a shift that is already well underway), valuations–not only at the moment of purchase, but also during the entirety of the holding period–will become increasingly important to the market’s return prospects.
To illustrate the point, imagine a demographically and technologically stagnant future world where dividends are punitively taxed, and where capital expenditures, in excess of depreciation, are neither needed nor profitable–a world where such expenditures do nothing but fuel competition, deflation, and profit margin shrinkage–put simply, a world that is Japan. If corporate managers in such a world are good stewards of capital, they will deploy 100% of their earnings into share repurchases. EPS growth will then be entirely determined by how much the repurchases contract the S, the share count. But the amount by which a given repurchase event contracts the S, the share count, is determined by the repurchase price–and therefore, the valuation. And so, in such a world, expensive valuations will depress EPS growth, and by extension, investor returns. The simulation above bears this out, with reinvested dividends as the proxy for share buybacks.
Crucially, a large portion of the EPS growth that was realized over the last 65 years was the result of expansive capital formation, the net building of new things that produced new profits, and an EPS that grew by the E. In a futuristic Japanese world where that driver of EPS growth is removed, and where all EPS growth results from repurchases, a shrinking S, the returns to an always-expensive scenario will be that much weaker.
If you’re an investor with a short time horizon, you should want valuations to stay high, or even better, go higher, into a bubble, so that you can get the most out of your holdings when you cash them out. But if you’re a disciplined investor that is in this for the long term, particularly a 20-something, 30-something, or even early 40-something, with a lot of income yet to be earned, you should not want valuations to stay where they are. You definitely should not want them to go higher, into a bubble. Instead, you should want the opposite of a bubble, a period of depressed valuations–the lower the better.
Granted, a rapid downward move in the markets, towards valuations that are genuinely cheap, would entail the pain and regret of mark-to-market losses on present holdings. But that pain and regret will only be short-term. In 20 or 30 or 50 or 65 years, the paper losses, by then evaporated, will have been long since forgotten, having proven themselves to have been nothing more than opportunities to compound wealth–monthly contributions, reinvested dividends, and share buybacks–at high rates of return. As Ronald Read’s example shows, the compounding adds up over time, allowing disciplined investors–even those of modest means–to build surprising fortunes.