It’s amazing to think that just last Monday, August 17th, the S&P 500 closed at 2102. Today, it closed at 1868, falling 11.1% in 6 trading days. The shocking speed of the decline has injected a level of fear into markets not seen since the fall of 2011, when the Eurozone debt crisis was reaching its apex. Many traders have referenced 1987 as a paradigm for what might happen in a worst case scenario over the coming days and weeks, so I figured it would be interesting to explore where exactly a 1987 scenario would take us in terms of prices.
The chart below shows the hypothetical price trajectory of the S&P 500 over the next 2 years if the current market ends up performing an exact repeat of the 1987 crash, with Friday, October 2nd, 1987 as the crash starting point:
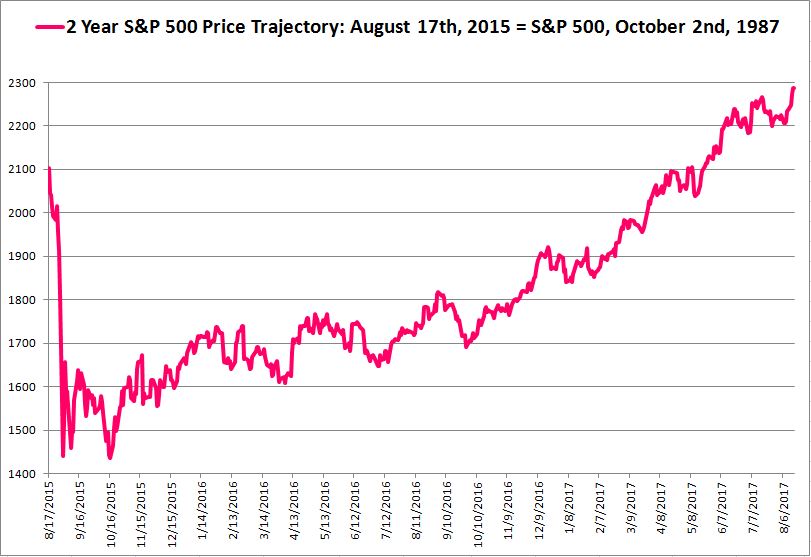
The closing low will occur on Monday, October 19th, 2015–less than two months from now–at an S&P level of 1435, a 32% correction in full. Fortunately, investors that hold their positions through the plunge will get their money back in short order, less than two years.
The next chart shows the hypothetical price trajectory of the S&P 500 over the next 2 years if the current market ends up performing an exact repeat of the 1974 crash, with Wednesday, March 13th, 1974 as the starting point:
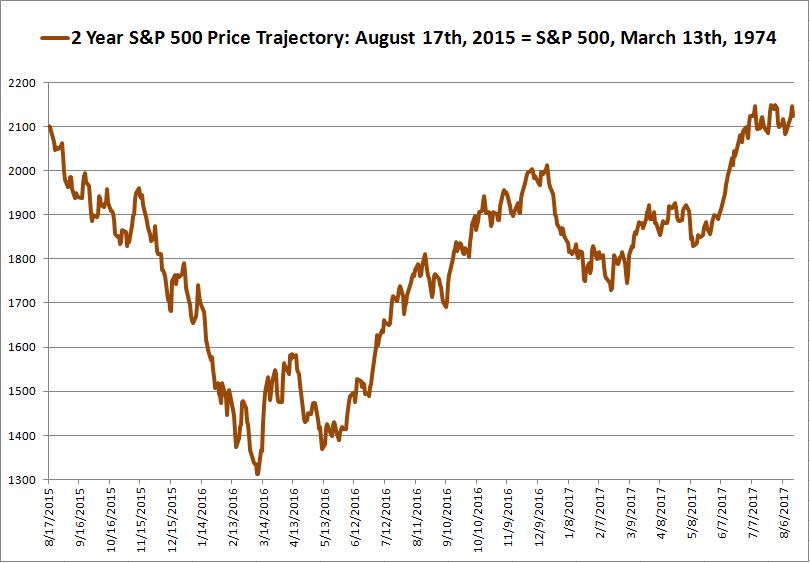
The closing low will occur on Tuesday, March 8, 2016, at an S&P level of 1311, completing a 37% correction in full. Again, investors that hold their positions through the plunge will get all of their money back within two years. But that’s only true in nominal terms. To get their money back in real, inflation-adjusted terms, with reinvested dividends included, they will have to wait until March of 2022.
The next chart shows the hypothetical price trajectory of the S&P 500 over the next 3 years if the current market ends up performing an exact repeat of the 1937 crash, with Wednesday, August 25th, 1937 as the starting point:
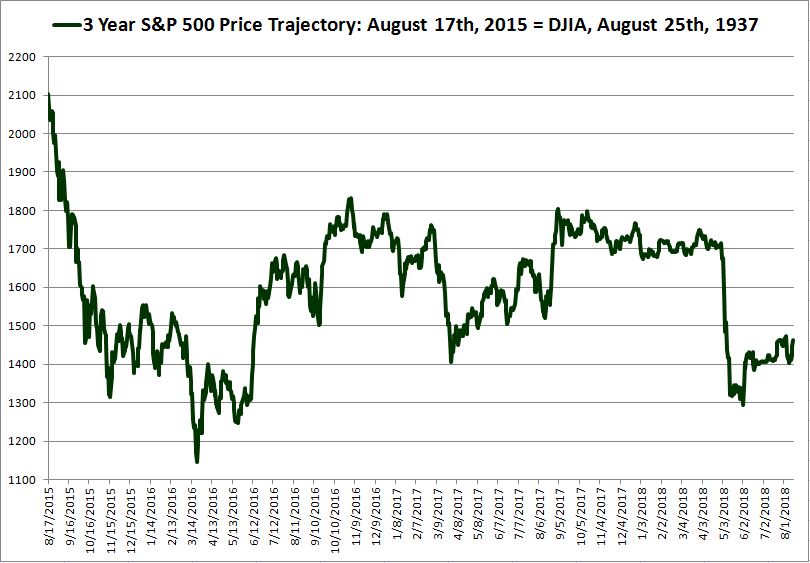
The closing low will occur on Tuesday, March 22nd, 2016, at an S&P level of 1144, for a 46% correction in full. In nominal terms, with reinvested dividends included, investors will have to wait until March of 2021 to get their money back. In real terms, they won’t get their money back until January of 2023.
Finally, the big one. This last chart shows the hypothetical price trajectory of the S&P 500 over the next 3 years if the current market ends up performing an exact repeat of the 1929 crash, with Thursday, October 17th, 1929 as the starting point:
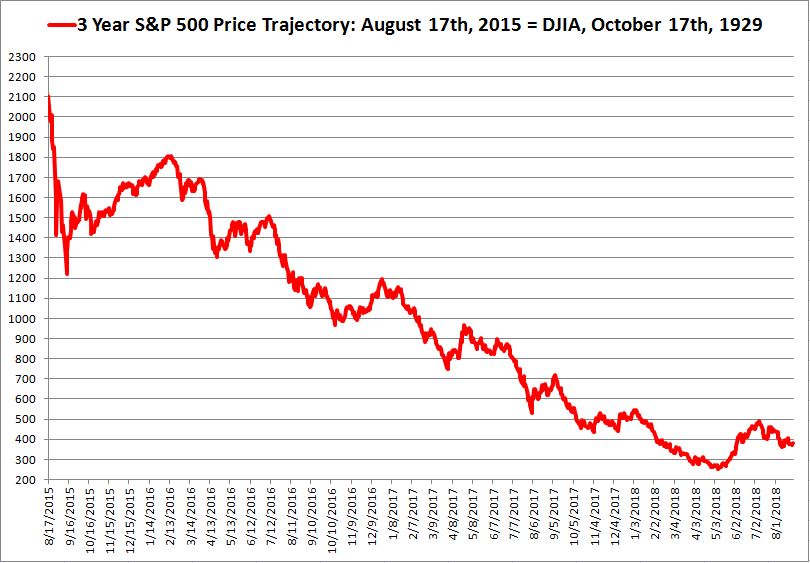
The closing low will occur on Tuesday, May 8th, 2018, at an S&P level of … brace for it … 253, an 88% correction in full. On a nominal total return basis, investors will not get their money back until October of 2030. Interestingly, given the severe deflation of the period, that date will end up coming much sooner in real terms–October of 2022.
Personally, I don’t expect a correction commensurate with any of these scenarios to play out. Even a 20% correction would surprise me. But history teaches us that large downward price moves are, and always have been, real possibilities in a market, even when everyone has a story for why they are unlikely.