If you had invested $100,000 in Altria Group ($MO) on March 31st, 1980, and reinvested the dividends, the position today would be worth $93.6MM–a 21.0% annualized return. If you had invested the same amount in Berkshire Hathaway ($BRK-A), the position would be worth $77.0MM–a 20.4% annualized return.
But now let’s assume that you were a high net worth individual, living in beautiful Newport Beach, California, holding the position outside of a retirement account (which is where the vast majority of high-end wealth is held). At current marginal rates, neglecting deductions, your dividends would have been taxed at 37.1%. That’s 20% for federal income tax, 13.3% for California state income tax, and 3.8% for the new Obamacare tax.
How would these taxes have impacted your returns? Instead of compounding at 21.0%, the Altria investment would have compounded at 19.0%. The final value of the investment would have been reduced by almost half, to $50.6MM. With Berkshire, however, the final investment value wouldn’t have changed at all. It would still be $77.0MM, because Berkshire didn’t pay any dividends. Of course, you would still owe taxes on the $77.0MM, but you would be able to pay them on your own schedule, whenever you wanted to use the money. And bear in mind that you would also have to pay taxes on the $50.6MM held in Altria.
We all recognize that taxes have a significant impact on long-term returns, especially when expected nominal returns are high. But we normally assume that the impact is limited to cases of excessive short-term trading, where capital gains that could have otherwise been deferred are prematurely incurred at punitive short-term rates. The truth, however, is that the detrimental impact of taxes extends beyond the space of capital gains, into the space of dividend income. As the example illustrates, owning a portfolio heavy on dividend-paying stocks like Altria and light on cashflow recyclers like Berkshire can impose a substantial drag on returns over time.
To quantify the impact of dividend taxes, I built a model that computes what the hypothetical after-tax total return of the S&P 500 would have been on the assumption of different historical dividend payout ratios. From 1871 to 2015, the S&P 500’s actual payout ratio averaged around 60%. But what if that payout ratio had instead always been equal to 40%? What if it had always been lower–say, 20%–or higher–say, 80%? What would the ensuing after-tax total return have been? The model correctly computes the answer. It takes the S&P 500 total return index and back calculates a hypothetical price and dividend index that is consistent with the specified payout ratio. It then subtracts dividend taxes from the dividend index and recomputes the total return, which is an after-tax total return. Comparing this after-tax total return to the original pre-tax total return gives the impact of dividend taxes.
The following table shows what the annualized tax drag on the S&P 500’s total return would have been from 1871 to 2015 if different payout ratios and tax rates had been in place. Note that the pre-tax return was 9%:
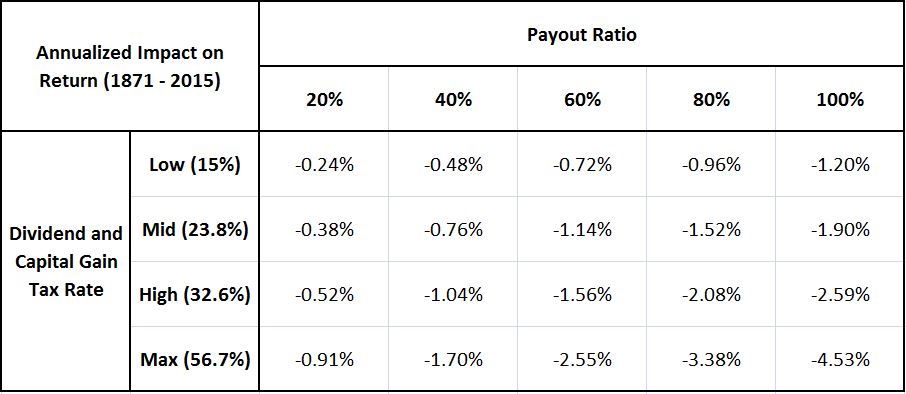
The “low” category, 15%, represents the lowest federal qualified dividend tax rate. The “mid” category, 23.8%, represents the highest federal qualified dividend tax rate. The “high” category, 32.6%, represents the highest total qualified dividend tax rate for an individual living in New York state paying New York state income taxes. The “max” category, 56.7%, represents the expected dividend tax rate for an individual in California earning in the top bracket and paying the unqualified federal dividend tax rate in addition to California state income taxes. This last rate is the rate that a high net worth individual living in California would pay on bond income, or on short-term trading profits, assuming that she were trading individual securities, rather than section 1256 futures contracts.
As the table confirms, the impact of taxes is huge. At a 60% payout ratio, a high net worth individual living in New York state who sticks to a disciplined buy and hold strategy would lose 1.56% per year to dividend taxes alone. If the market’s payout ratio were increased to 100%, she would lose 2.59% per year. Note that a 100% payout ratio essentially mimics a case where all gains come from trading. So if a California resident were to earn all of her returns from trading, and were to pay the maximum marginal income tax rate on those gains, she would lose 4.53% per year relative to the untaxed alternative.
If markets are efficient and maximally aligned to shareholder interests, then we should expect the following two observed changes to continue over time:
First, dividend payout ratios should continue to fall on a cyclically-adjusted basis, particularly as wealth inequality increases. If investors, specifically high net worth investors, are paying attention to their costs, they will seek out companies that reinvest excess cash flows into acquisitions and buybacks rather than companies that pay out excess cash flows as dividends. CEOs seeking to maximize their share prices will then be incented to favor reinvestment–to behave more like Berkshire and less like Altria.
Second, stocks should continue to trade at historically expensive prices. For much of history, the tax benefit that equities conferred upon investors–specifically, the ability to use capital appreciation to defer taxation–was not adequately reflected in equity prices and valuations. Those benefits have actually increased in recent decades, as dividend payout ratios have fallen, and as preferential tax rates for equity income and capital gains have been introduced into law.
As markets become more efficient over time, we should expect these tax benefits to more fully show up in equity prices. This is particularly true in the current environment, where investors have become increasingly focused on reducing unnecessary costs, and where an increasing amount of societal wealth has concentrated into the hands of high net worth investors, those who stand to receive the greatest tax benefits from equities.
Consider the financial options of a high net worth individual living in California. She can choose to hold her wealth in shares of Berkshire and pay no tax at all on the returns unless or until she needs to consume out of them, at which point she will be able to monetize them at a preferential long-term rate, or she can own fixed income securities–say, a 30 year treasury bond–and pay a whopping 56.7% tax rate on the earnings. In the case of the 30 year bond, at a 2.90% yield, her after-tax yield would be a paltry 1.26%. Unless equities were in an outright bubble, with extremely low imputed returns, what reason could she possibly have, as a long-term investor, to choose the fixed income option?