The following table shows the historical win rate and average excess performance of the MMA timing strategy versus the X/Y portfolio and the RISK portfolio in the universe of global currencies:

The following table shows the performances of the different strategies for each individual currency pair. In contrast to other tests, we conduct the switching in these tests on the basis of price (exchange rate) rather than accumulated total return:

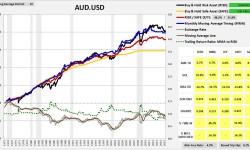
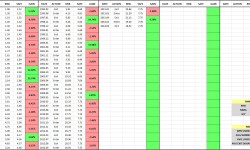
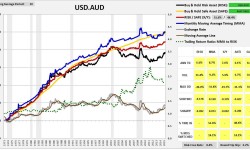
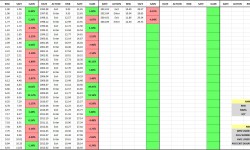
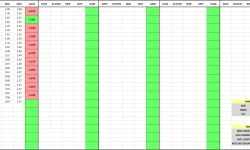
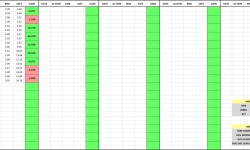
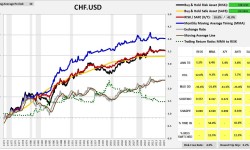
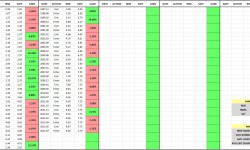
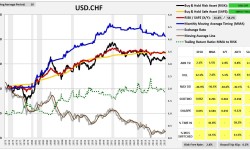
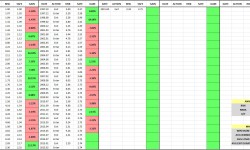
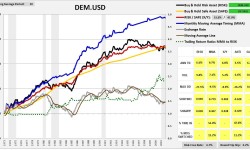
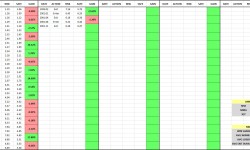
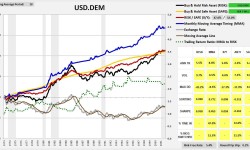
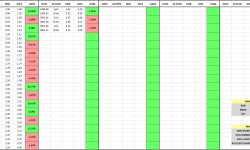
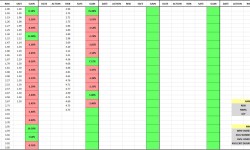
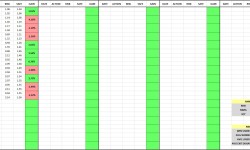
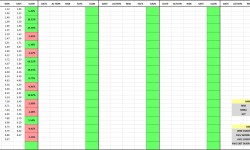
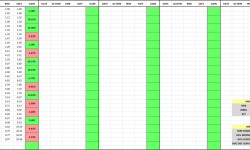
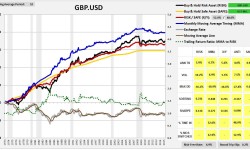
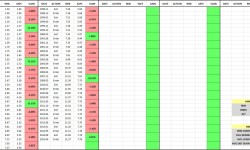
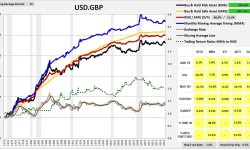
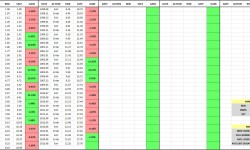
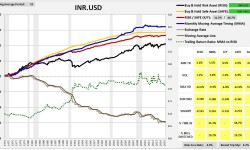
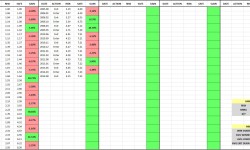
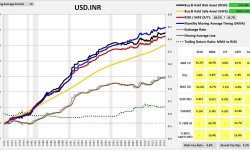
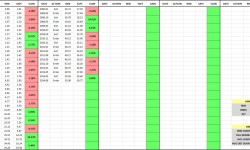
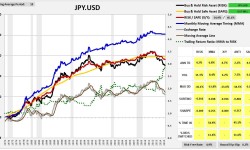
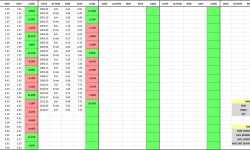
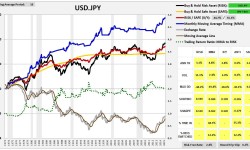
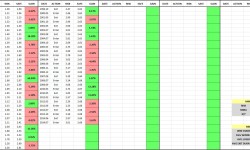
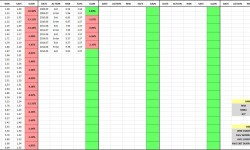
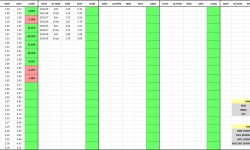
The following charts provide visual illustrations of the individual performances. The tables to the right of the charts show the MMA strategy’s entry/exit dates and registered gains/losses (relative to buy and hold). The charts and tables form a slideshow that begins when any image is clicked:
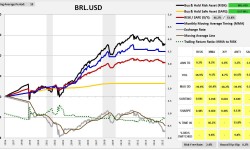
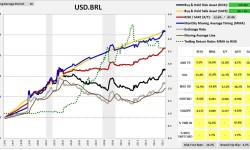
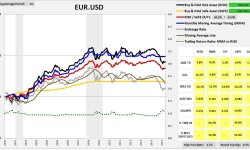
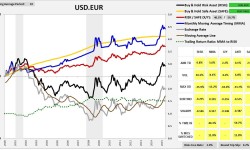
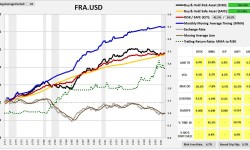
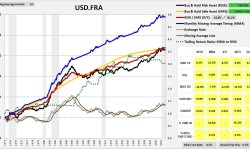
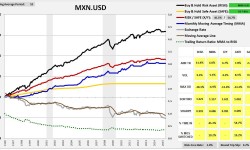
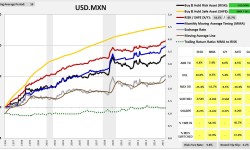
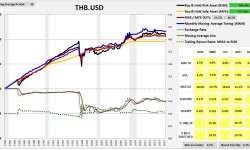
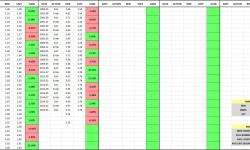
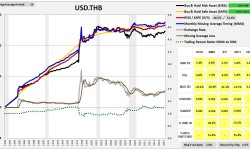
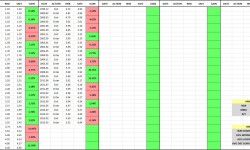
Public Source: FRED, National Central Bank Websites.