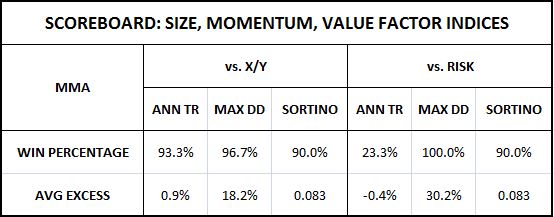
The following table shows the historical win rate and average excess performance of the MMA timing strategy versus the X/Y portfolio and the RISK portfolio in the the size, momentum, and value factor indices constructed by the Center for Research in Stock Prices (CRSP):
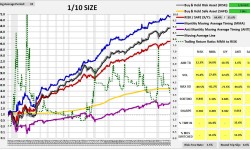
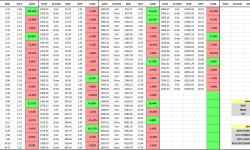
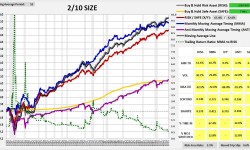
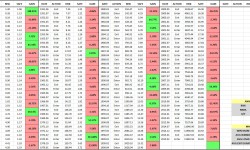
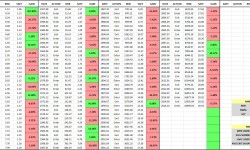
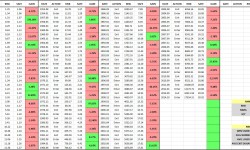
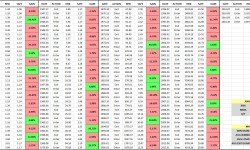
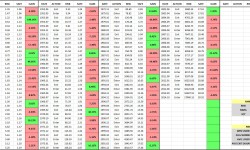
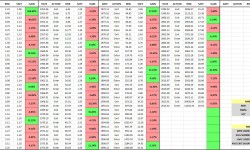
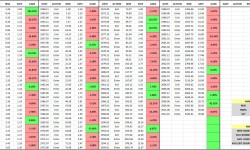
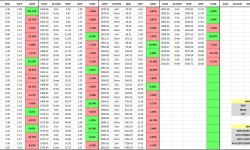
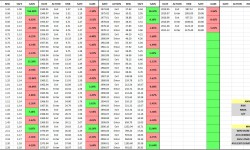
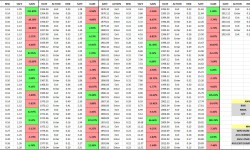
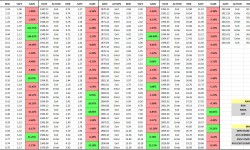
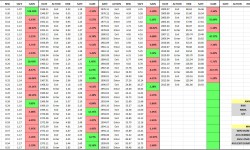
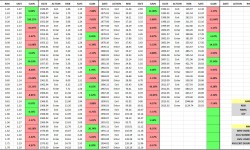
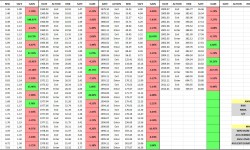
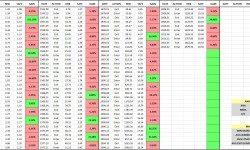
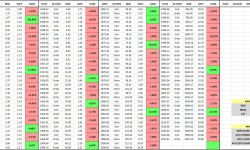
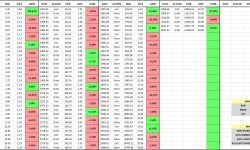
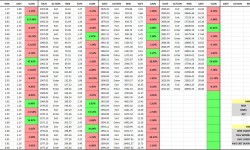
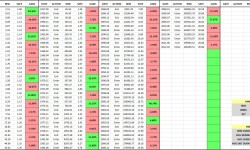
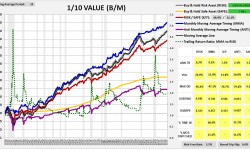
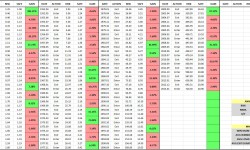
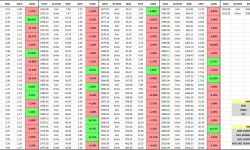
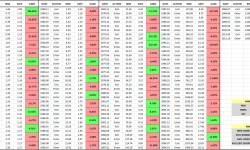
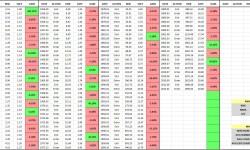
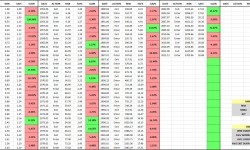
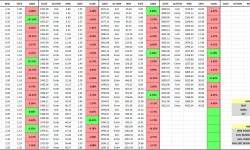
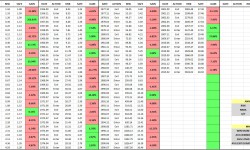
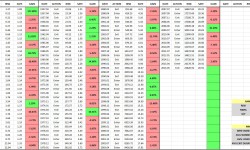
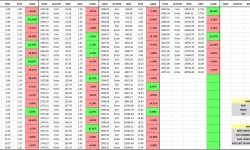
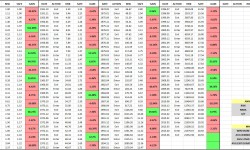
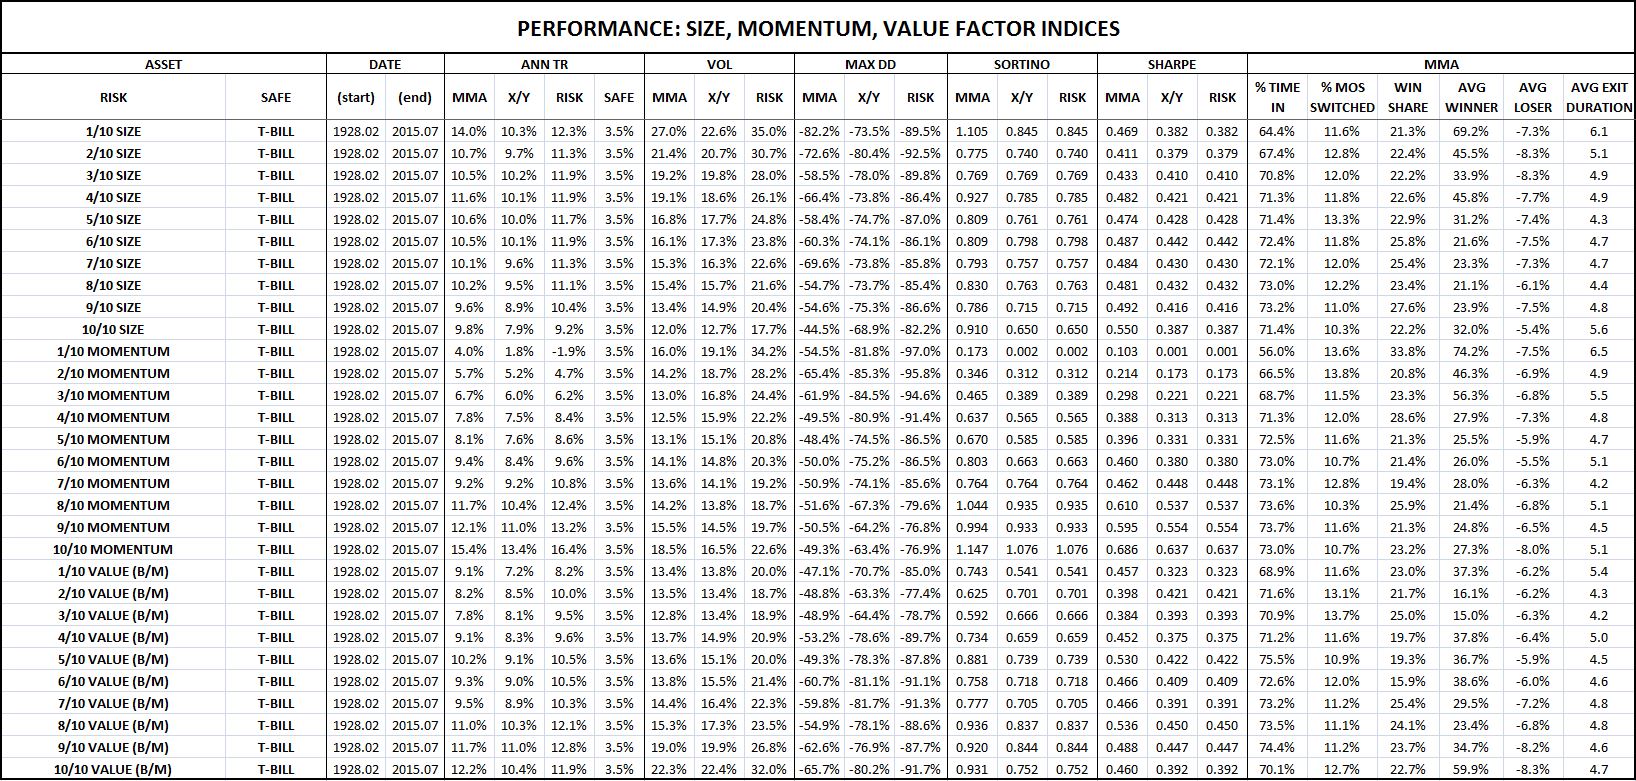
The following tables show the performance numbers of the different strategies for each factor index. For the different factors–size, momentum, and value–1/10 represents the collection of stocks with the lowest, and 10/10 the collection of stocks with the highest:
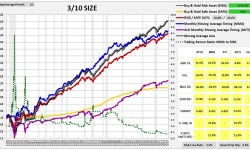
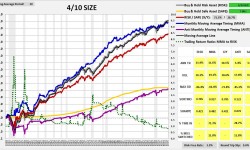
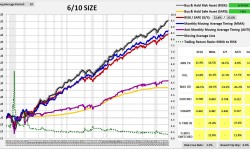
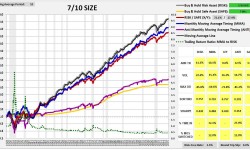
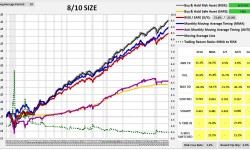
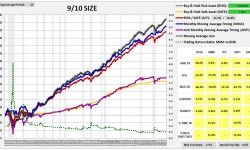
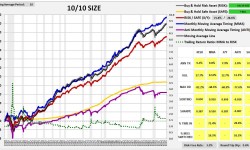
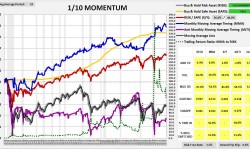
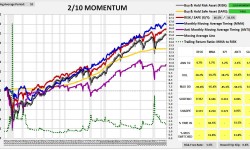
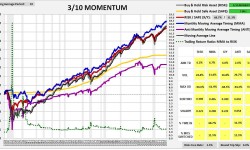
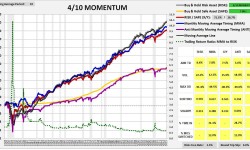
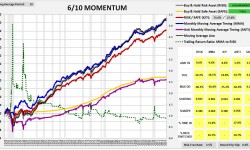
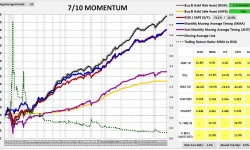
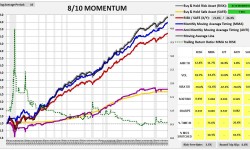
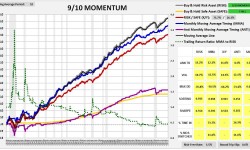
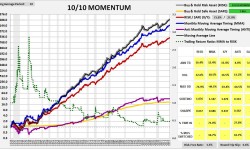
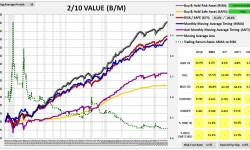
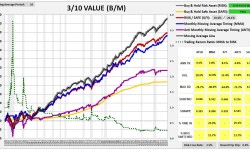
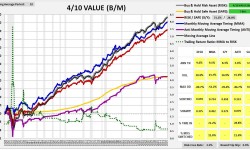
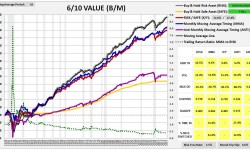
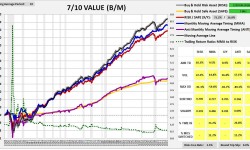
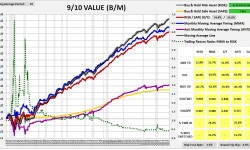
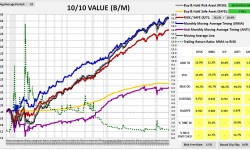
The following charts provide visual illustrations of the individual performances. The tables to the right of the charts show the MMA strategy’s entry/exit dates and registered gains/losses (relative to buy and hold). The charts and tables form a slideshow that begins when any image is clicked: