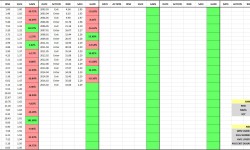
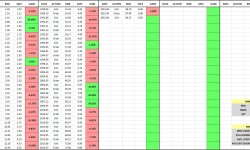
The following table shows the historical win rate and average excess performance of the MMA timing strategy versus the X/Y portfolio and the RISK portfolio in the universe of foreign equities, with prices and returns measured in U.S. dollar terms:

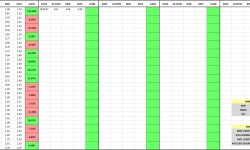
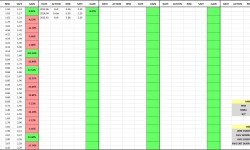
The following two tables show the performance numbers of the different strategies in each foreign market. The first table is focused primarily on larger, developed markets, the second on smaller, emerging markets:


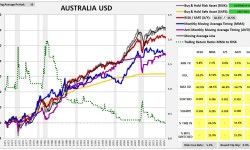
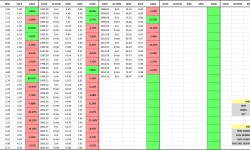
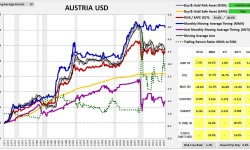
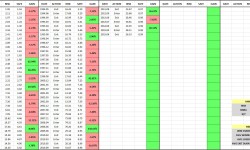
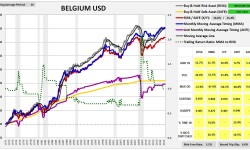
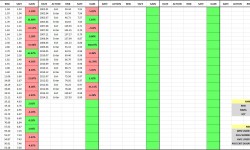
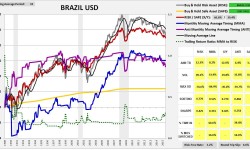
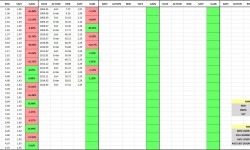
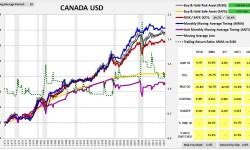
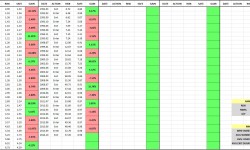
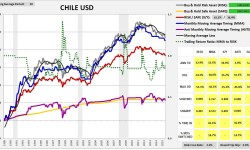
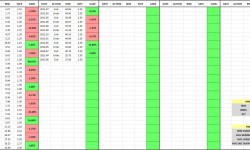
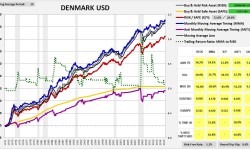
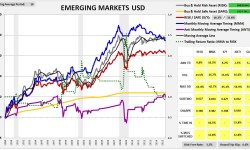
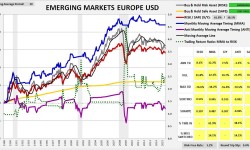
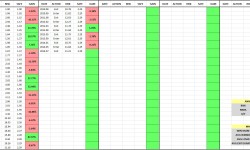
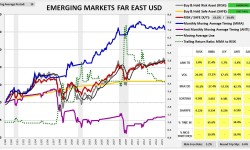
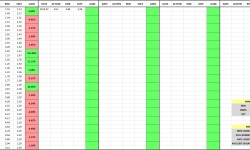
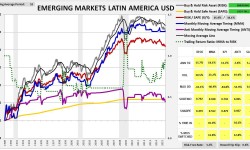
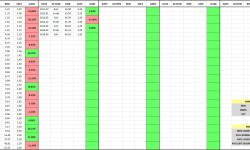
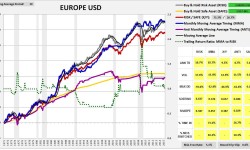
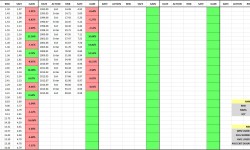
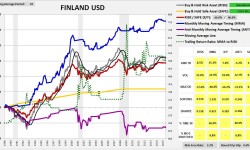
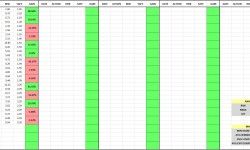
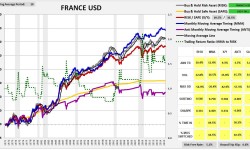
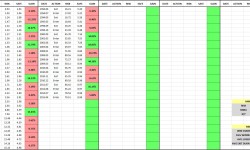
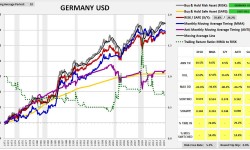
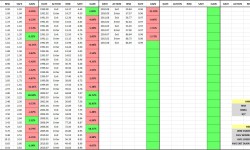
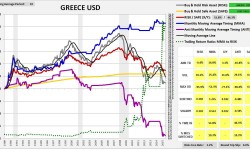
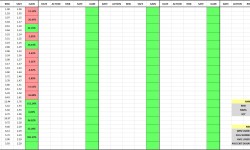
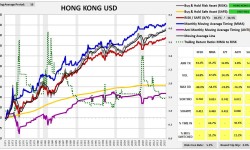
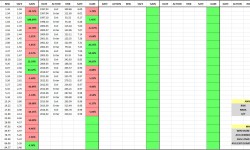
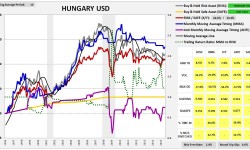
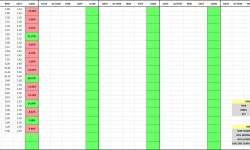
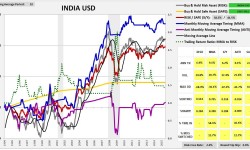
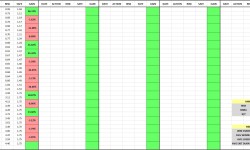
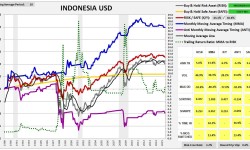
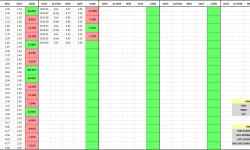
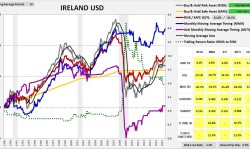
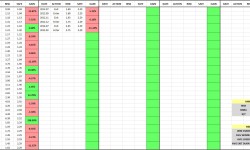
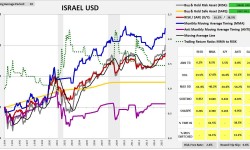
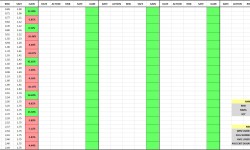
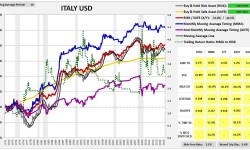
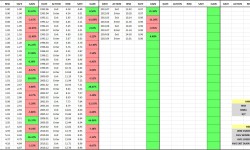
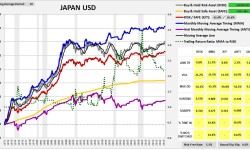
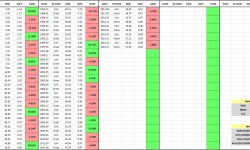
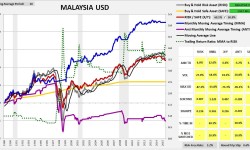
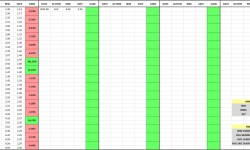
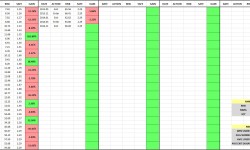
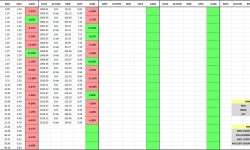
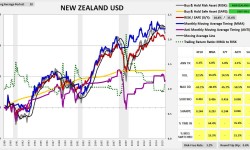
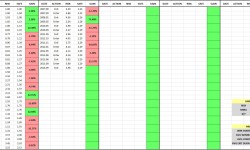
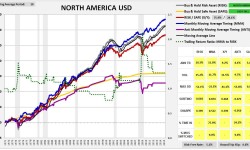
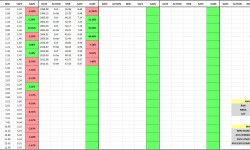
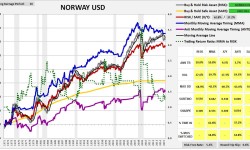
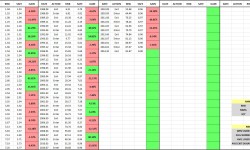
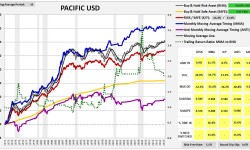
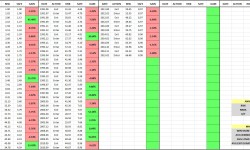
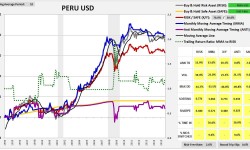
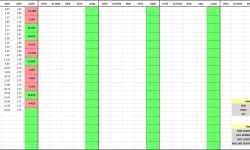
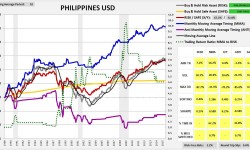
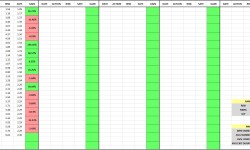
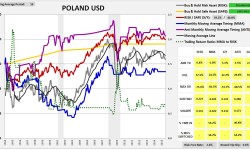
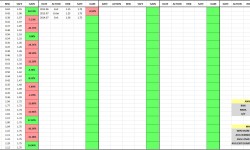
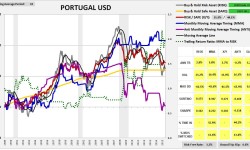
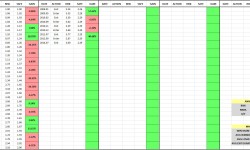
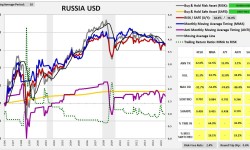
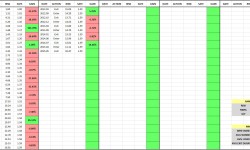
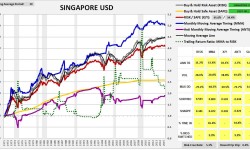
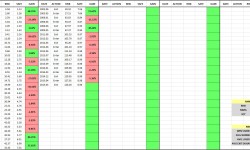
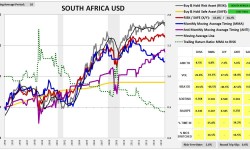
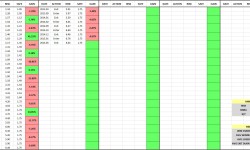
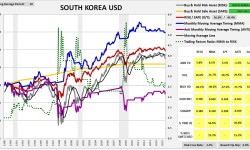
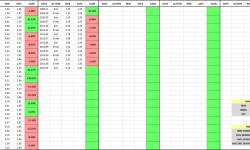
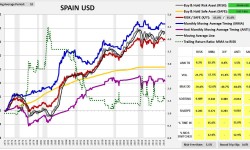
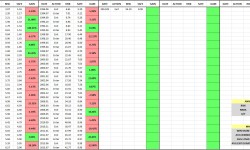
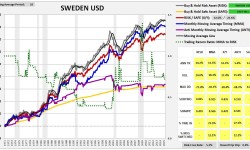
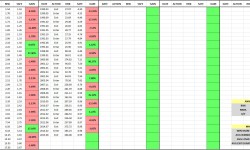
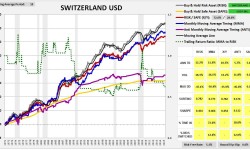
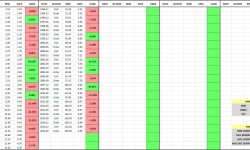
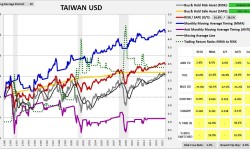
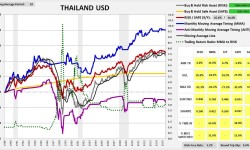
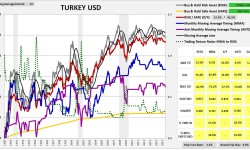
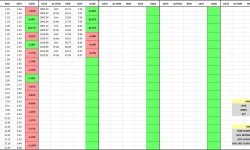
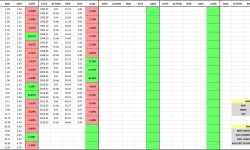
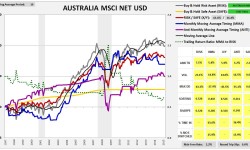
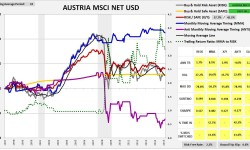
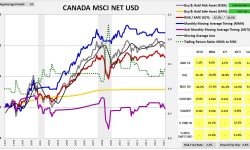
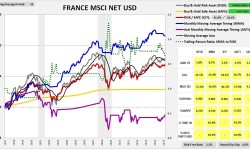
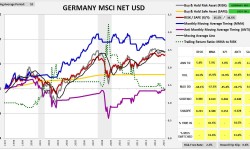
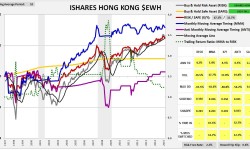
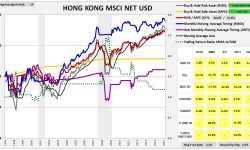
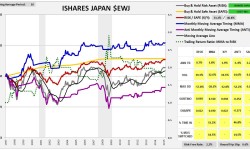
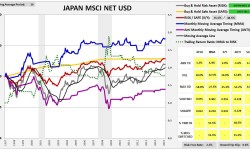
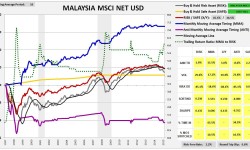
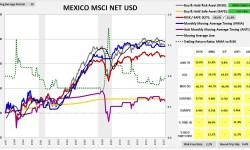
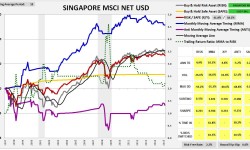
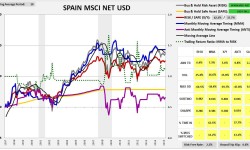
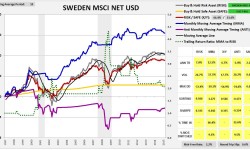
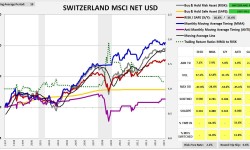
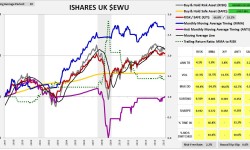
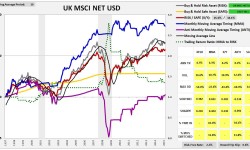
The following charts provide visual illustrations of the individual performances. The tables to the right of the charts show the MMA strategy’s entry/exit dates and registered gains/losses (relative to buy and hold). The charts and tables form a slideshow that begins when any image is clicked:

If we were to implement the MMA timing strategy in practice, the instruments that we would most likely use would be International ETFs, the most popular of which are managed by Ishares. Because Ishares International ETFs have trading histories that extend back to 1996, and because these ETFs are designed to track the MSCI indices that we are using to conduct our tests, we can use the ETFs to do a theory-to-practice check–that is, we can verify that the results obtained from implementing the strategy with actual traded securities match the results obtained from implementing the strategy using indices, as they should if all is well.
Unfortunately, when we conduct that check, we observe deviations between the ETF results and the Index results. The strategy still outperforms when using ETFs, but not by the same amount. The returns are consistently lower, the drawdowns consistently higher, and the risk-reward measurements consistently poorer. We might try to blame the lower ETF returns on the fact that ETFs take out fund fees and transaction costs, whereas Indices don’t. But fund fees and transaction costs on the typical foreign index ETF are too small to explain the performance deviation.
The following table shows the deviation in the win rates and average outperformances for the strategy using tradeable ETFs and published indices. As you can see, the difference between the two, particularly in annualized excess total return, is sizeable–roughly 150 basis points, far more than the fees and transaction costs of an ETF should end up taking out:

The following table shows the actual performance numbers for the ETF and Index tests. For the Index tests, we use MSCI’s net Total Return category, which incorporates foreign tax withholdings. Still, an observable deviation remains:

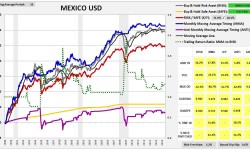
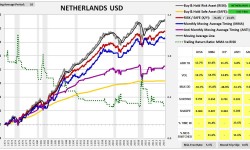
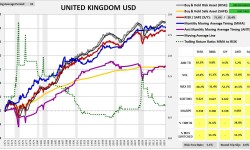
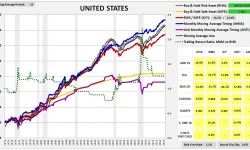
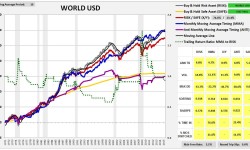
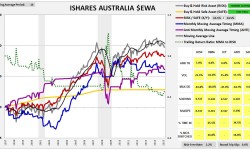
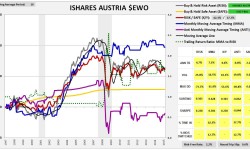
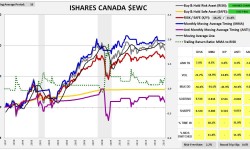
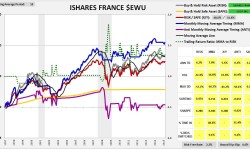
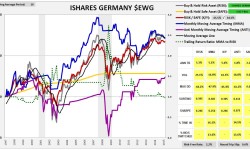
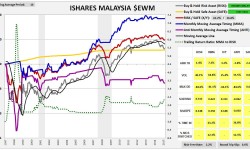
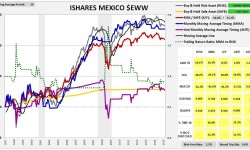
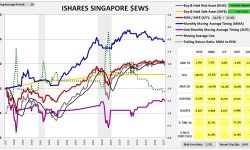
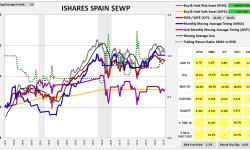
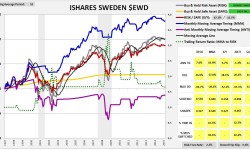
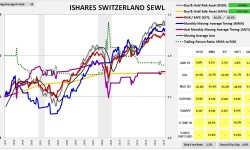
The following charts provide visual illustrations of the ETF and index implementations of the strategy side by side, starting in 1997:
Source: MSCI, Goyal, for the ETFs, any website with price and dividend quotes, e.g., Yahoo Finance.