The following table shows the historical win percentage and average excess performance of the MMA timing strategy versus the X/Y portfolio and the RISK portfolio for the 100 largest S&P 500 stocks that have public trading histories spanning back to before 1995:

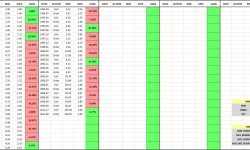
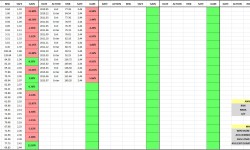
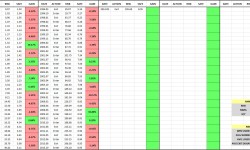
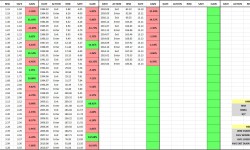
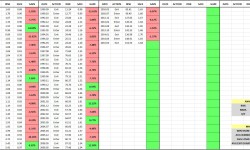
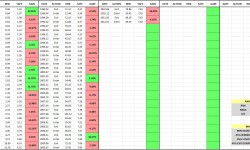
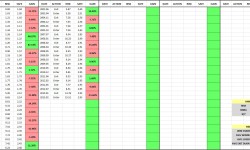
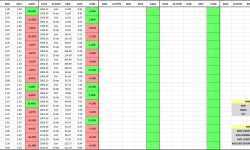
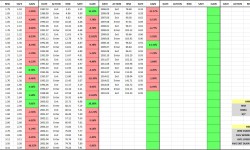
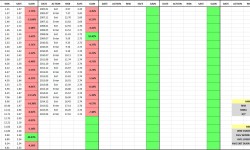
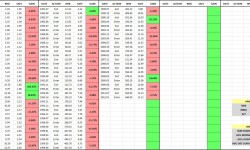
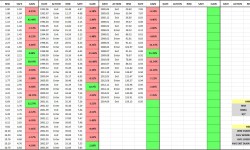
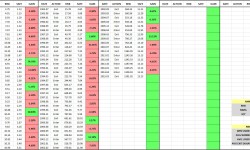
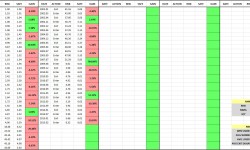
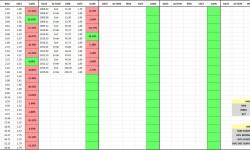
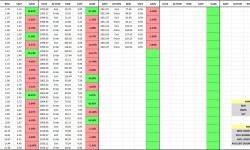
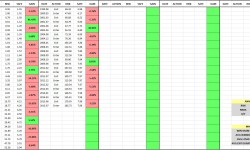
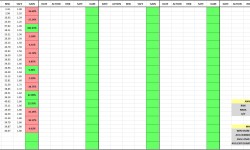
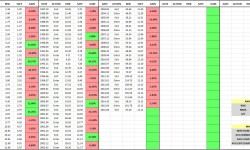
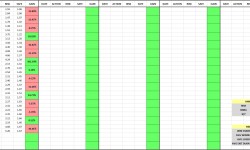
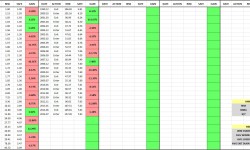
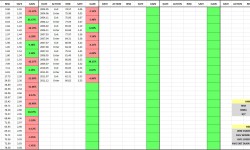
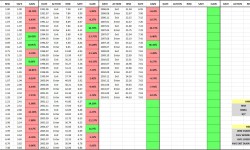
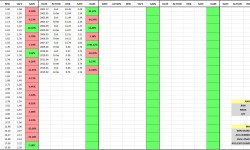
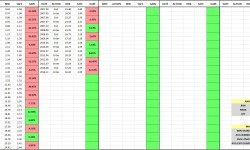
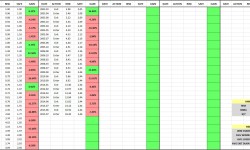
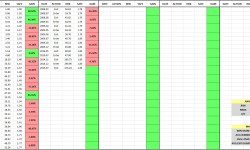
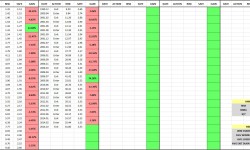
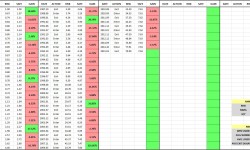
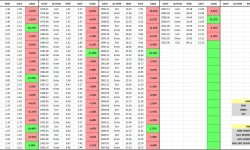
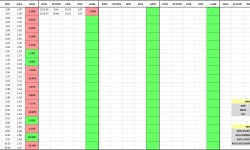
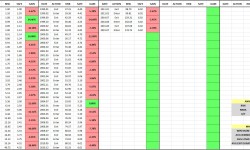
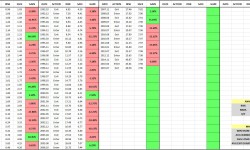
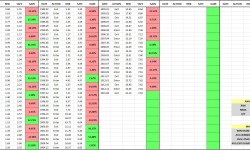
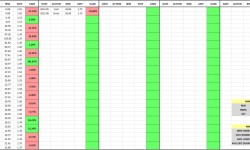
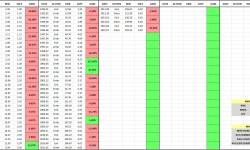
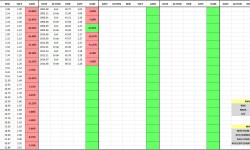
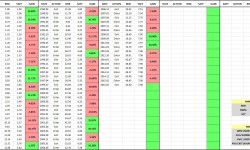
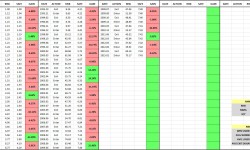
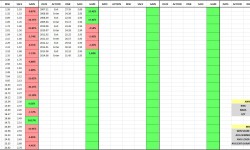
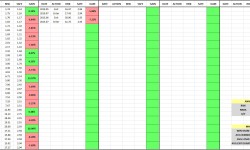
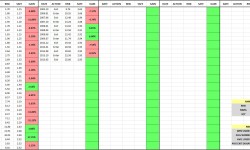
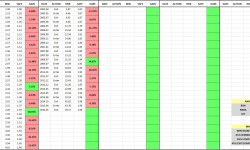
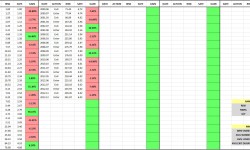
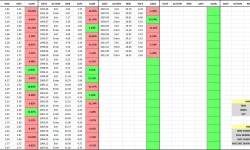
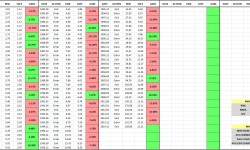
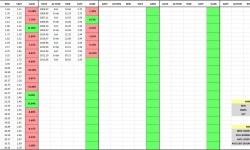
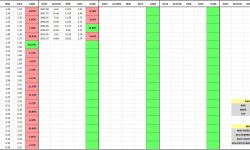
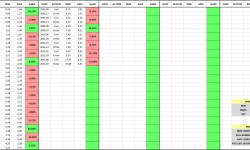
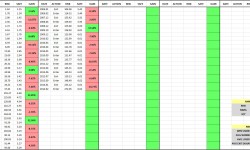
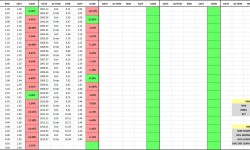
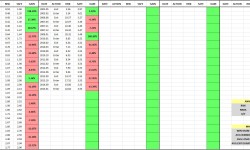
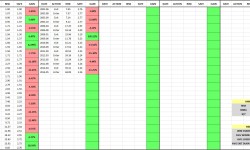
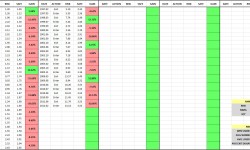
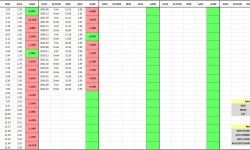
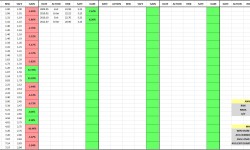
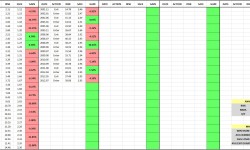
The following four tables show the performances of the different strategies for each of the individual stocks:


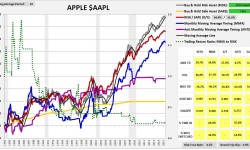
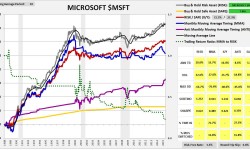
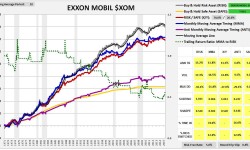
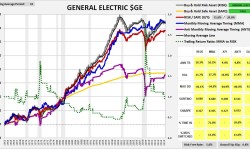
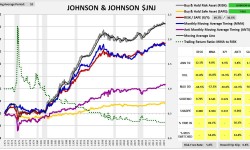
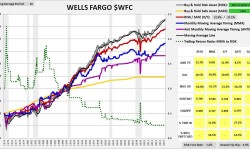
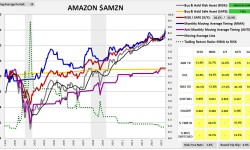
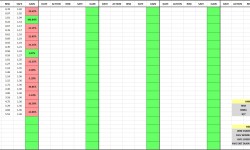
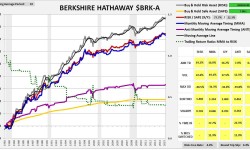
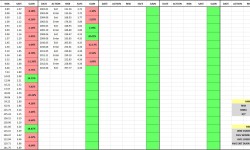
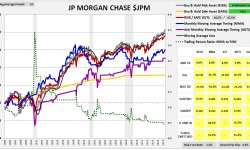
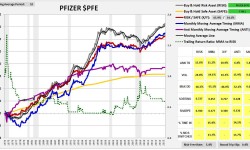
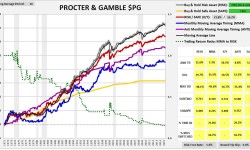
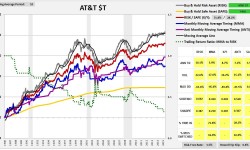
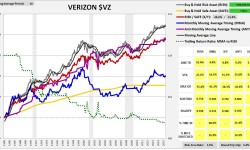
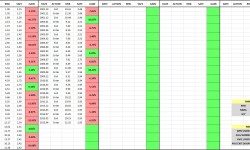
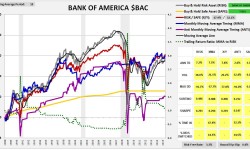
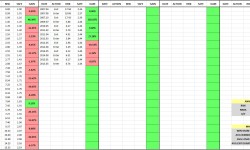
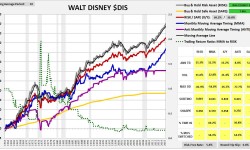
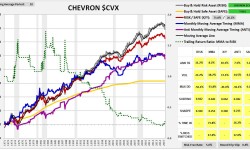
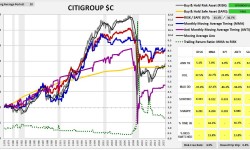
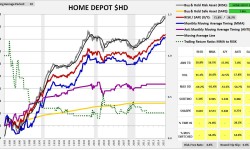
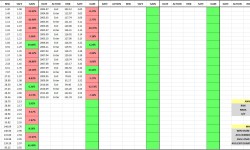
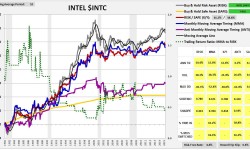
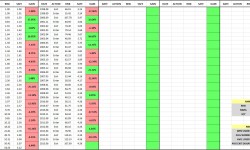
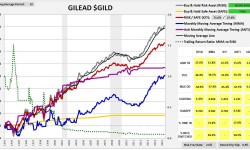
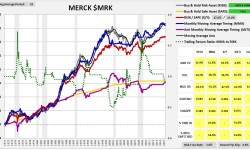
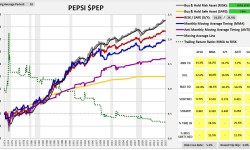
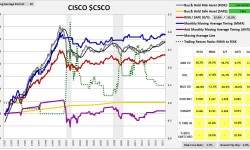
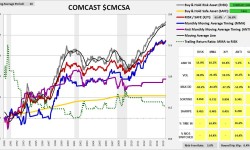
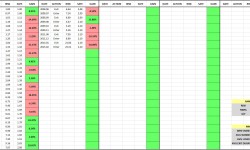
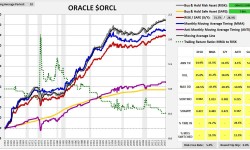
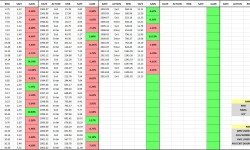
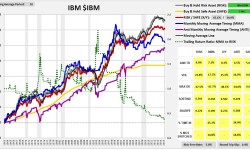
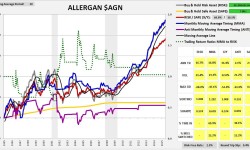
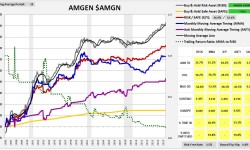
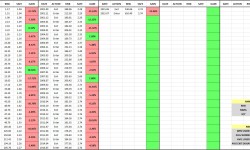
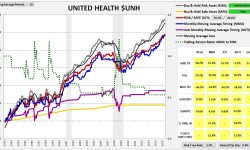
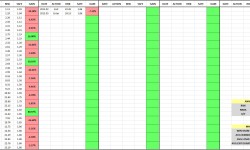
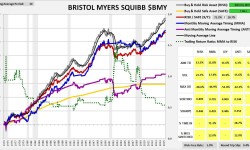
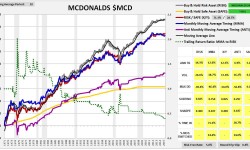
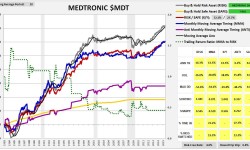
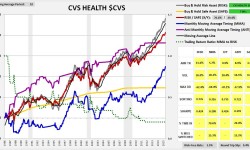
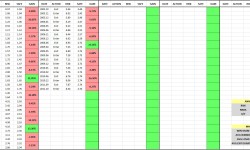
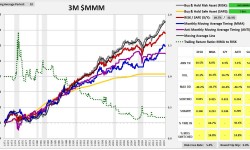
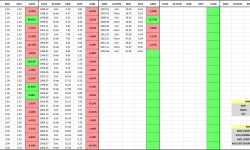
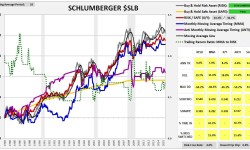
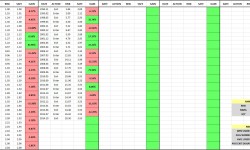
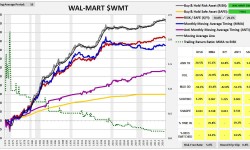
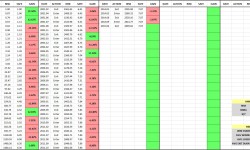
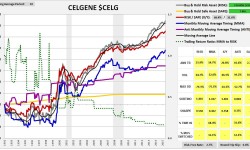
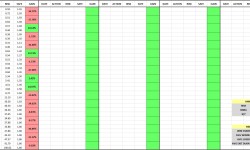
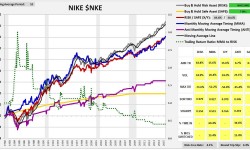
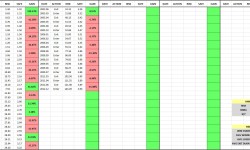
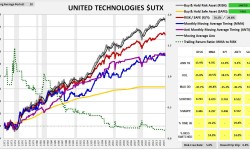
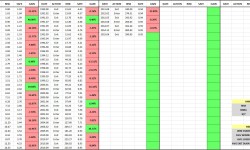
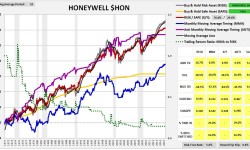
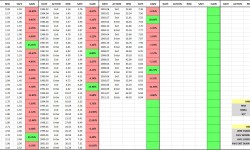
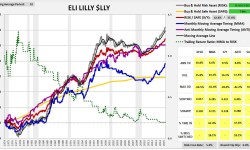
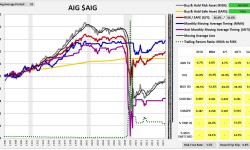
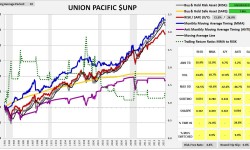
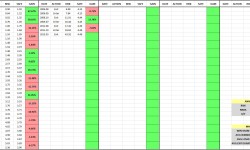
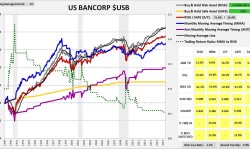
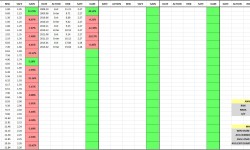
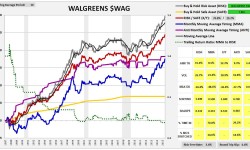
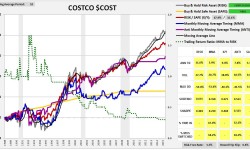
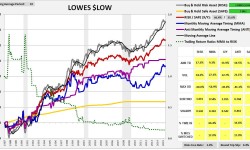
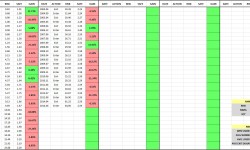
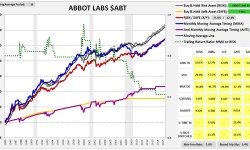
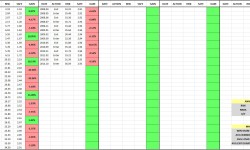
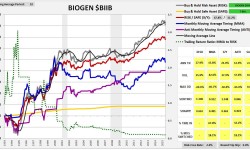
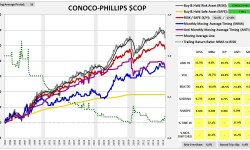
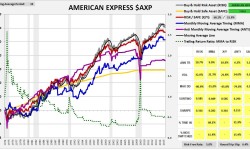
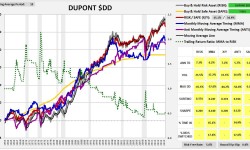
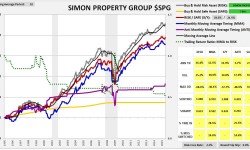
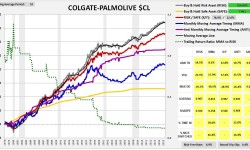
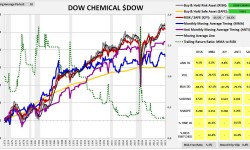
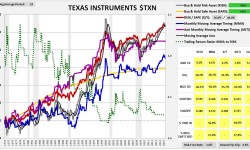
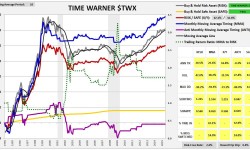
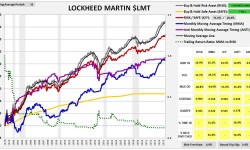
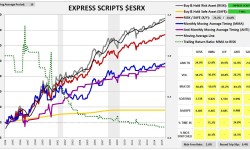
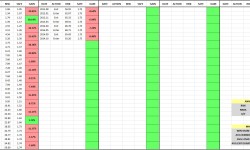
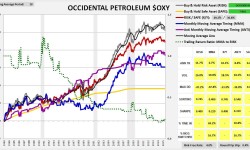
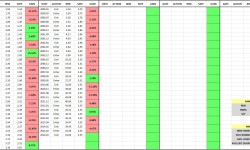
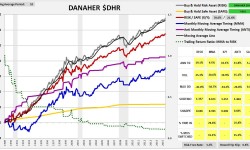
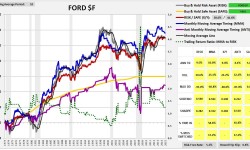
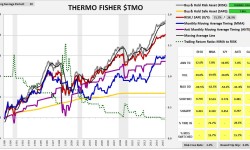
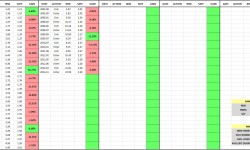
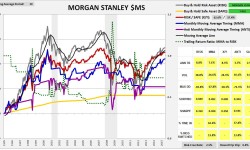
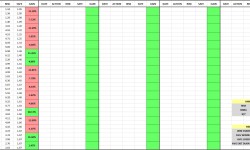
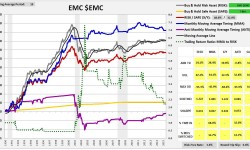
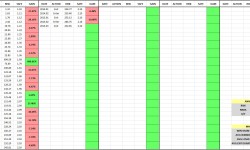
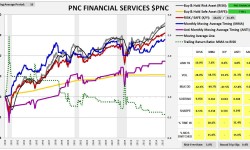
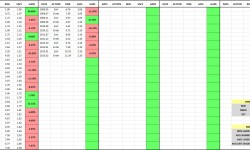
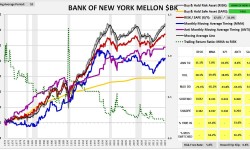
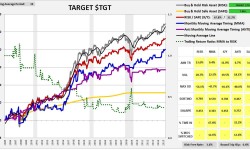
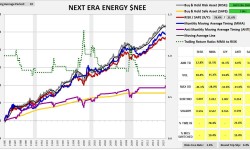
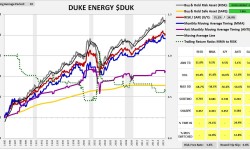
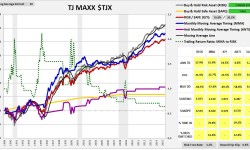
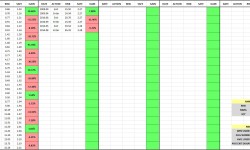
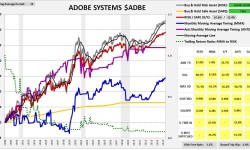
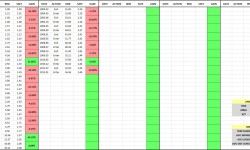
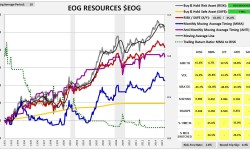
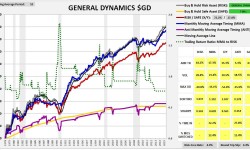
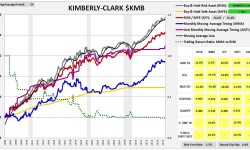
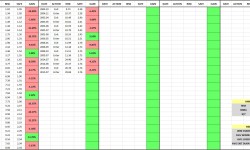
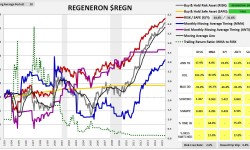
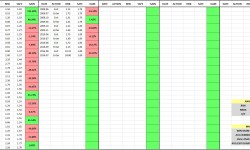
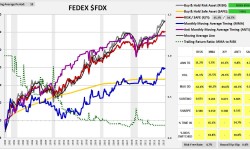
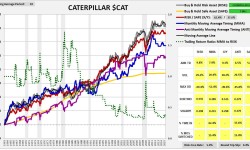
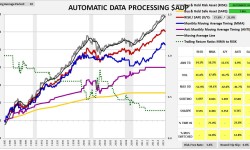
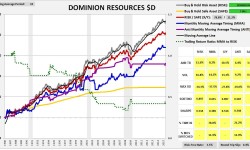
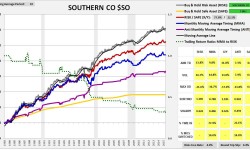
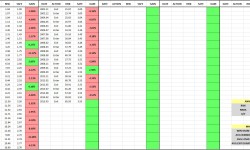
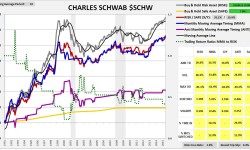
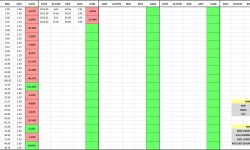
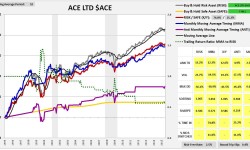
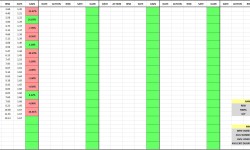
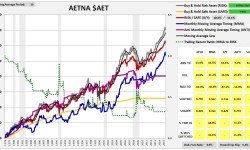
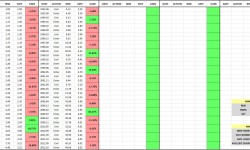
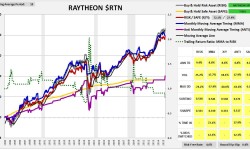
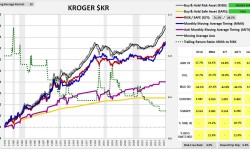
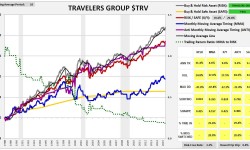
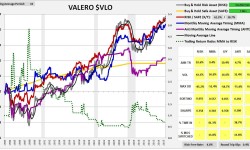
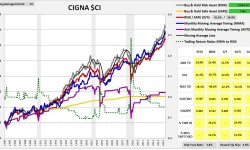
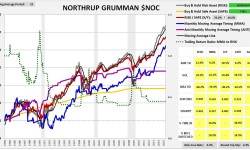
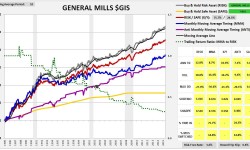
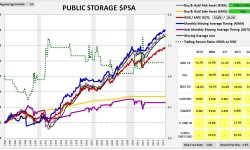
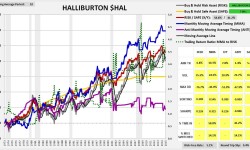
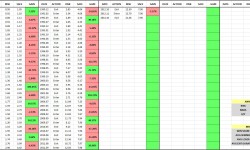
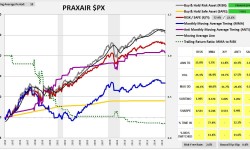
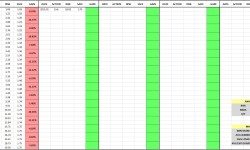
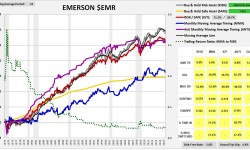
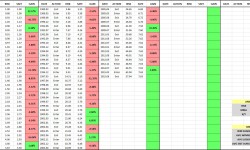
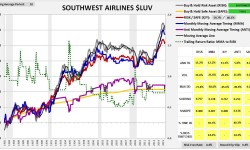
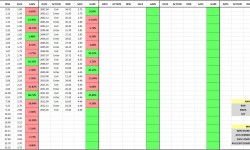
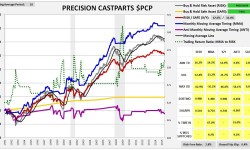
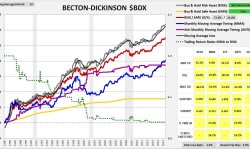
The following charts provide visual illustrations of the individual performances. The tables to the right of the charts show the MMA strategy’s entry/exit dates and registered gains/losses (relative to buy and hold). The charts and tables form a slideshow that begins when any image is clicked:


Source: Goyal, any website with price and dividend quotes, e.g., Yahoo Finance.