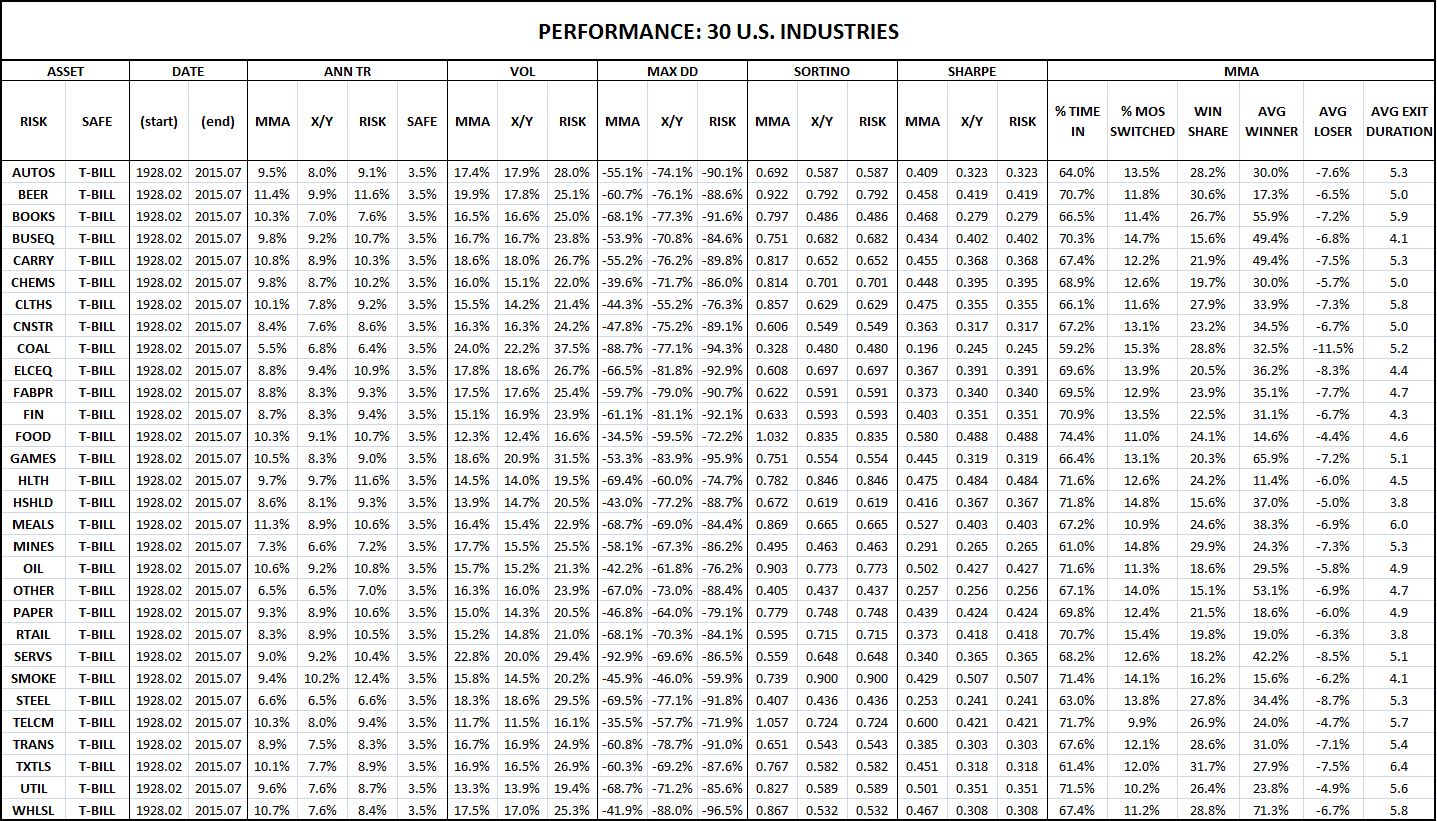
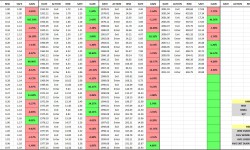
The following table shows the historical win percentage and average excess performance of the MMA timing strategy versus the X/Y portfolio and the RISK portfolio for 30 U.S. industry indices:

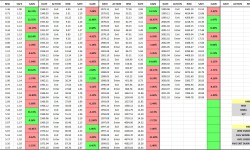
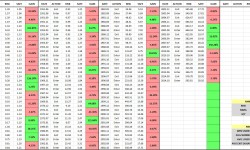
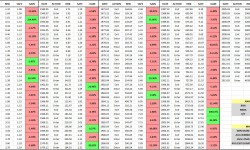
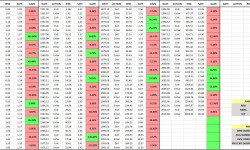
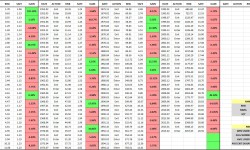
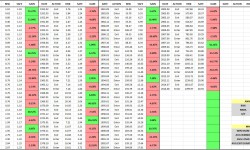
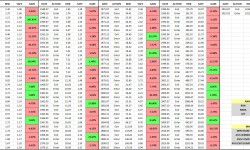
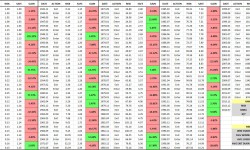
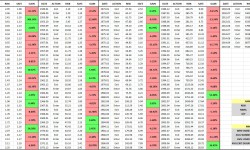
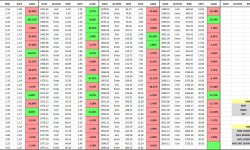
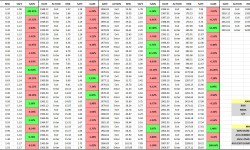
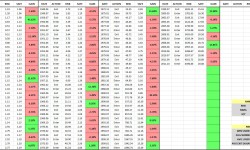
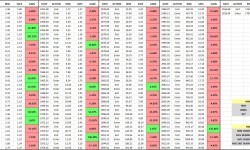
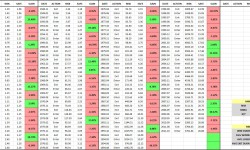
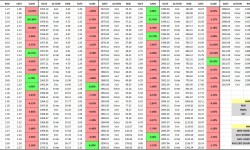
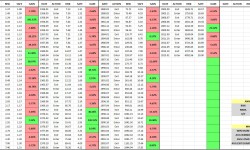
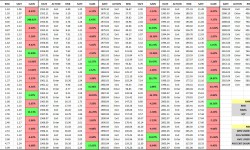
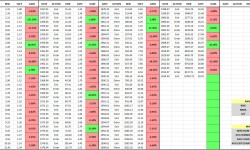
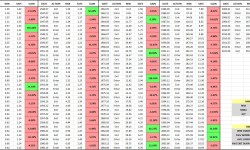
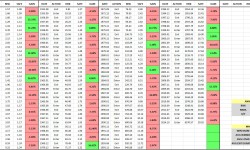
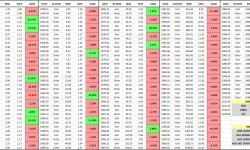
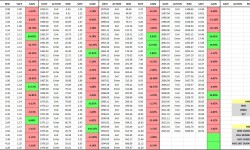
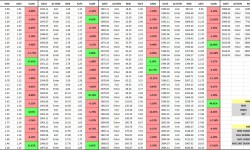
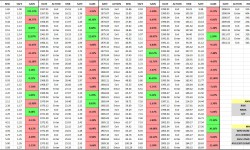
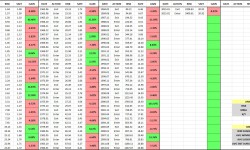
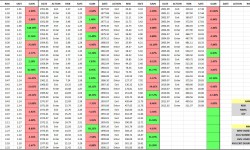
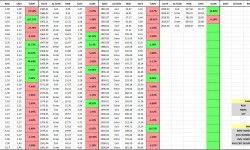
The following table shows the performance numbers of the different strategies for each industry index:
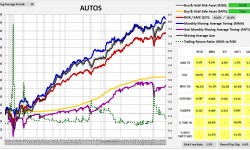
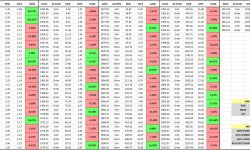
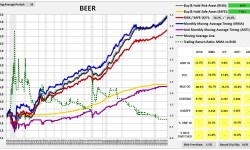
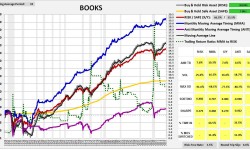
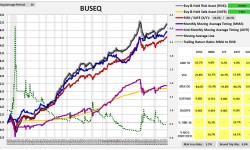
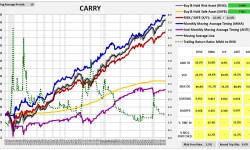
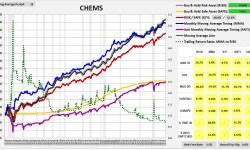
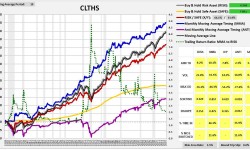
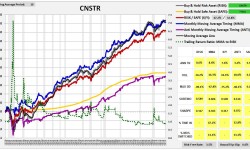
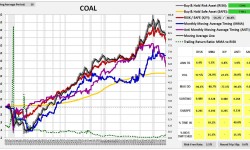
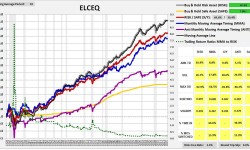
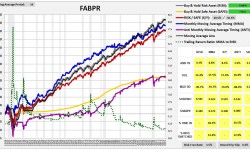
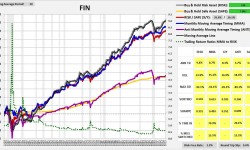
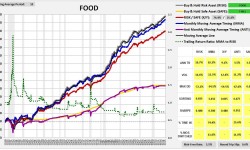
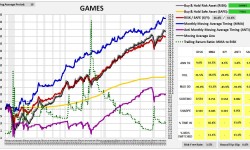
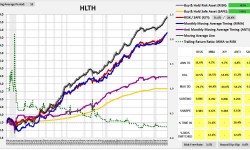
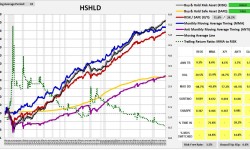
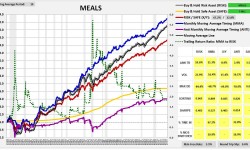
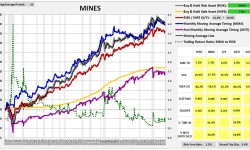
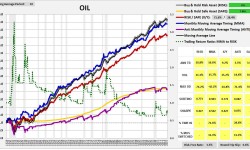
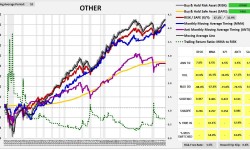
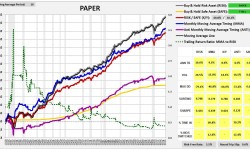
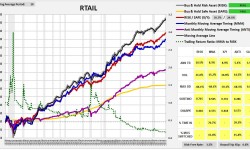
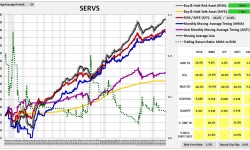
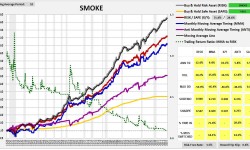
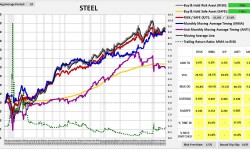
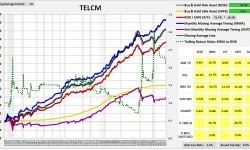
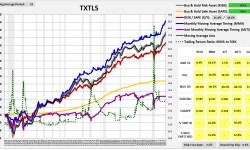
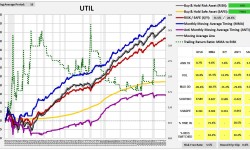
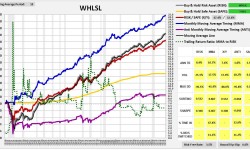
The following charts provide visual illustrations of the individual performances. The tables to the right of the charts show the MMA strategy’s entry/exit dates and registered gains/losses (relative to buy and hold). The charts and tables form a slideshow that begins when any image is clicked:
The 30 industries are defined as follows: