The following table shows the historical win rate and average excess performance of the MMA timing strategy versus the X/Y portfolio and the RISK portfolio in a sampling of individual stocks that represent “roadkill” from the tech, housing, and commodity bubbles.

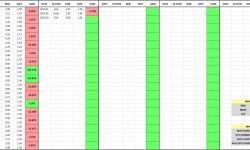
The following table shows the performances of the different strategies for each individual name:

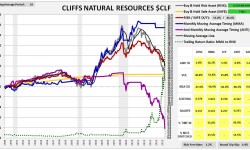
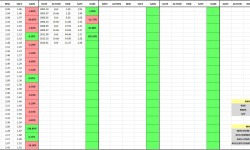
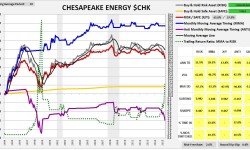
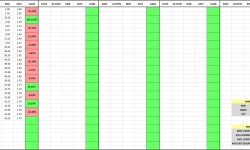
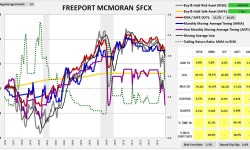
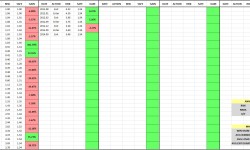
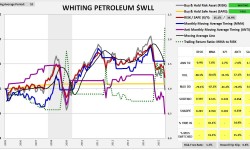
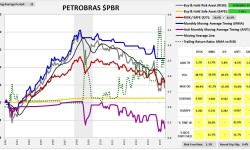
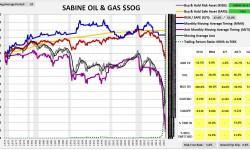
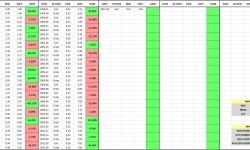
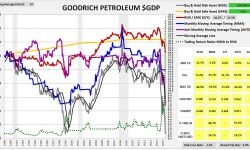
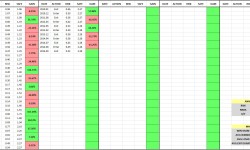
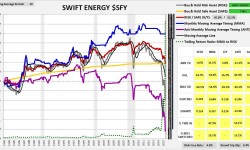
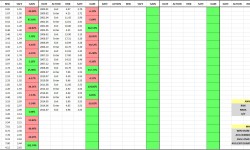
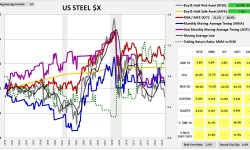
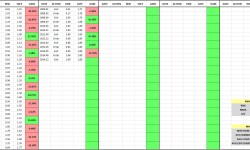
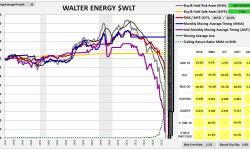
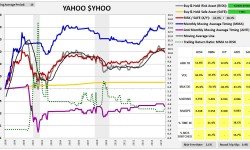
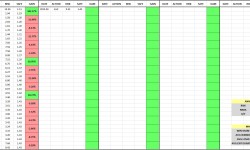
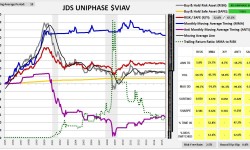
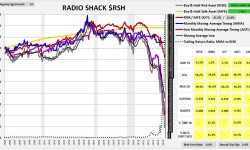
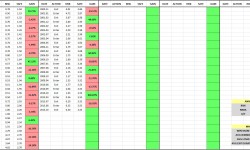
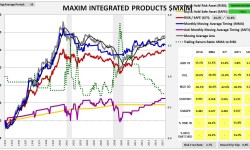
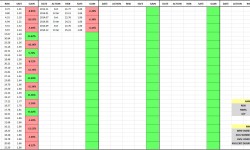
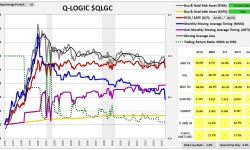
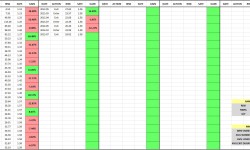
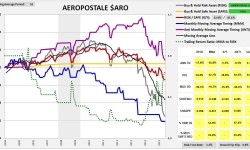
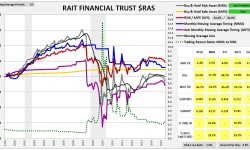
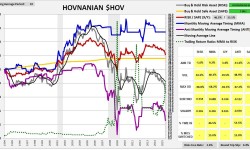
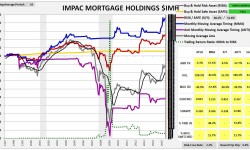
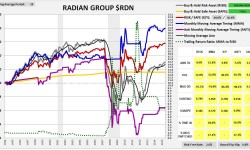
The following charts provide visual illustrations of the performances. The tables to the right show the MMA strategy’s entry/exit dates and registered gains/losses (relative to buy and hold). The charts and tables form a slideshow that starts when any image is clicked:


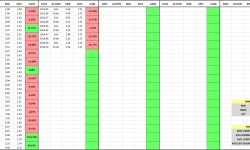
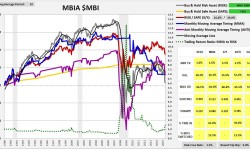
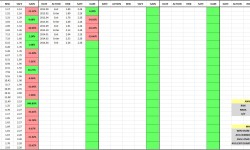
Source: Goyal, Any website that provides stock price and dividend quotes, e.g., Yahoo Finance.