The following table shows the historical win rate and average excess performance of the MMA timing strategy versus the X/Y portfolio and the RISK portfolio for US equities in aggregate:

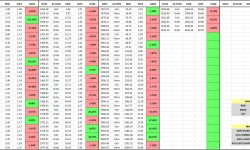
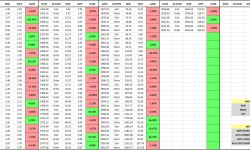
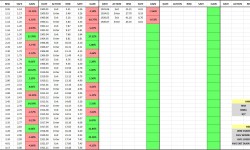
The following table shows the individual performances of the different strategies across various date ranges and safe asset choices. Note that we’ve alternated the safe asset between Treasury Bills, the 10 Year Treasury Note, Long-Term Corporate Bonds, and Gold, to show the effect on performance. Note also that available Cowles Commission prices before 1927 are averages of monthly high and low prices, rather than closing prices. To allow a timing strategy to transact at those prices would effectively give the strategy the ability to peek into the future before timing decisions are made. To remove that ability, a 1 month lag is inserted into the strategy, so that the strategy makes the decision to switch not based on the current month’s signal, but based on the previous month’s signal:

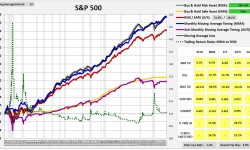
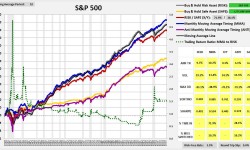
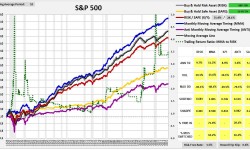
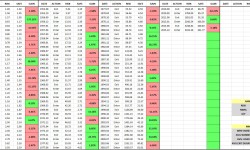
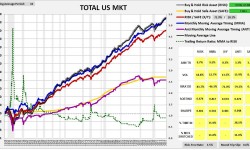
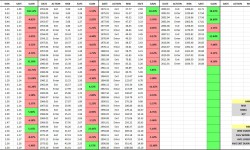
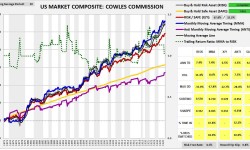
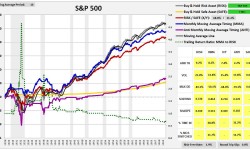
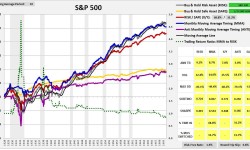
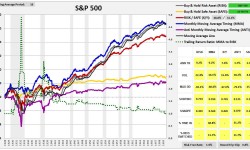
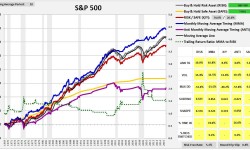
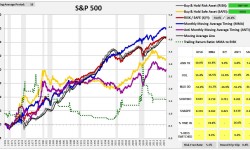
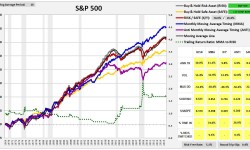
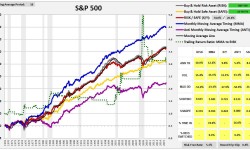
The following charts provide visual illustrations of the individual performances. The tables to the right of the charts show the MMA strategy’s entry/exit dates and registered gains/losses (relative to buy and hold). The charts and tables form a slideshow that begins when any image is clicked: