Those who expect U.S. equities to deliver poor returns going forward can cite two compelling reasons in defense of their expectation:
(1) Equity prices are significantly elevated relative to underlying earnings fundamentals. The S&P 500’s trailing price-to-earnings ratio, for example, is 20.5 on a GAAP basis and 18.8 on an operating basis, more than a full standard deviation above the historical average of ~14 for GAAP, and ~13 for operating.
(2) Earnings, which make up the E in the P/E ratio, are artificially high, having been pushed up by elevated levels of corporate profitability, which are anywhere from 30% to 70% above their historical averages, depending on the choice of measurement.
Removing the effects of changes in valuation, the average historical real total return for U.S. equities has been roughly 6% per year. If U.S. equity P/E ratios and profitability levels were to fall back to their historical averages, this 6% return would get dragged down to roughly zero. Over a 10 year horizon, the P/E ratio compression would subtract roughly (13/18.8)^(1/10)-1 = 3.6%. The profitability compression, on the generous assumption that current profitability is only 30% above its natural level, would subtract another (1/1.3)^(1/10)-1 = 2.6%.
The problem, of course, is that it’s possible that “this time is different”–with respect to both P/E ratios and profitability levels. It’s true that P/E ratios are substantially elevated relative to the long-term historical average, but that average might not represent the natural level for the current environment, which is characterized by:
- Aggressive policymaker advocacy and monetary support for equity markets, rendered possible by an environment of persistently weak inflation. This advocacy and support increases investor confidence and creates an environment in which there is no alternative (T.I.N.A) to equities for anyone that wants to earn a return (which is almost everyone).
- Greater cultural affinity for equity investing, brought about, in part, by the historical lesson, now learned by virtually all, that equities are the best place to invest money for the long-term. Equities just don’t get cheap like they used to. The market in general is too efficient, too adapted, too familiar with its own history to allow that to happen.
These arguments are sure to raise the hairs on certain people’s skins–“this time is different” is a very dangerous claim. But clichés aside, the underlying claim might be true. The fact that valuations have managed to stay historically elevated for so long–well over 20 years now–without showing any sign of retreating, increases the probability that the claim actually is true.
On the profitability front, the U.S. economy has evolved dramatically over the course of history. It’s quite possible that in this evolution, barriers to competitive entry have emerged that didn’t previously exist–first-mover barriers, network ownership barriers, regulatory barriers, patent barriers, and so on. In trying to understand how dominant, best-in-breed companies–the $MSFT’s, $GOOG’s, $FB’s, and $AAPL’s of the world–have been able to to capture and hold on to absurdly high levels of profitability, in contravention of normal competitive forces, these barriers would seem to be an obvious culprit.
The fact that profitability levels have stayed high for over 20 years now, showing little inclination to sustainably retreat, gives support to this view. Additional support is provided by the fact that the elevated profitability levels seem to be concentrated in very specific industries and capitalization categories–technology, finance, and large cap multinational–rather than evenly distributed across the overall market. For that reason, there’s likely to be a sustainable causal explanation for their emergence.
Now, none of this is offered to suggest that valuations and profit margins won’t retreat going forward. My own view is that they will retreat, and are already in the process of doing so. I just don’t think that they are likely to retreat all the way back to past averages. It seems to me that to expect such an outcome, one has to completely ignore the relevant differences that exist between the modern era and prior eras.
One thing we can be reasonably sure of, however, is that if U.S. equity valuations stay where they are for the long-term, then returns will suffer by a different mechanism. That mechanism is what I’m now going to try to quantify.
Recall that the Total Return EPS index is an index that tells us what EPS would have been if all historical dividends that were actually paid out to shareholders had instead been diverted into share buybacks, where they would have stayed inside the equity. Crucially, in constructing the Total Return EPS index, we conduct the share buybacks at hypothetical prices corresponding to the same valuation across history, rather than at the prices that were actually quoted in the market, which encompassed significantly different valuations at different points in time.
Because share buybacks are functionally identical to reinvested dividends in terms of their effects on total return, and because the Total Return EPS index assumes that all share buybacks are conducted at the same valuation, the index effectively tells us what the Total Return to investors would have been if the effect of changes in valuation had been completely removed.
To illustrate, suppose that the U.S. equity market had always traded at 19 times earnings. If we had bought the market in January 1966, at 19 times earnings, reinvested all of our dividends at 19 times earnings, and then sold out 10 years later, in January 1976, at 19 times earnings, what would our return have been? To get to the answer, we simply build a Total Return EPS index on the assumption that all share buybacks are conducted at 19 times earnings. We then calculate the annualized rate of growth of that index from January 1966 to January 1976. That rate of growth will be the hypothetical total return under the stipulated conditions of constant valuation.
The market’s P/E ratio is substantially elevated on a historical basis. In order for this elevation to not impose an eventual drag on returns, the elevation will have to persist indefinitely into the future. But if it persists, then the dividends that corporations pay out to shareholders will be reinvested at historically expensive prices. Because those dividends will be expensively reinvested, they will accrete at historically depressed rates of return, producing historically depressed total returns. There is essentially no way to escape this conclusion.
For perspective, if, from 1871 to 2015, the U.S. stock market had always traded at its average historical valuation, shareholders would have earned an average rolling 10 year real total return of approximately 6.3% per year. Of that return, 1.65% would have come from organic EPS growth, and the other 4.65% would have come from dividends reinvested into the market. But if those dividends had not been reinvested, and had instead been kept idle in a brokerage account collecting interest at the short-term rate, their return contribution would have fallen from 4.65% to well less than 1%, for a total return below 3%, less than half of the actual. Right off the bat, then, we can appreciate the fact that the reinvestment of dividends, and the implied rate of return at which the reinvestment is conducted, matters to total return–big time.
To quantify the impact that varying dividend reinvestment valuations have on total return, I’m now going to run a series of simulations. I’m going to build 25 different Total Return EPS indices for the period January 1871 to March 2015, with the share buybacks in each index conducted at Shiller CAPE levels ranging from 5 to 30 in unit increments. For each Total Return EPS index, I’m going to calculate the average rolling 10 year real growth rate of the index across its history, which, you will recall, is the average rolling 10 year real total return that investors would have earned if valuations had stayed constant at the specified Shiller CAPE level. I’m then going to chart the total returns as a function of the different valuations. The ensuing charts will give us a clear picture of how much total return we should expect to lose if valuations stay elevated at present levels.
Before I can do that, I need a non-controversial formulation of the Shiller CAPE. To that end, I’m going to use the Total Return EPS CAPE (the Shiller CAPE adjusted for changes in dividend payout ratios). I’m going to employ two specific versions of that CAPE: one built on GAAP earnings (which include the questionable goodwill writedowns of the post-2002 era, writedowns that resulted from the application of accounting standards that were not applied to prior eras and that therefore make for distorted historical comparisons), and one built with operating earnings substituted in after 1998 (which exclude the goodwill writedowns, but which might also exclude other types of justified accounting losses that would make a historical comparison to GAAP earnings unfair).
The two versions are shown below alongside the original Shiller CAPE.

As you can see, the Total Return EPS CAPE built on GAAP earnings (yellow, current value: 25.96) is not much different from the original Shiller CAPE (red, current value 27.52), which suggests that historical changes in dividend payout ratios haven’t appreciably affected the accuracy of the original. However, the post-2002 writedowns make a big difference. When removed, they bring the Total Return EPS CAPE (blue) down to a current value of 21.93. Note that all of these CAPEs have been normalized so that their averages are equal to the average of the Original Shiller CAPE–14.19 on a harmonic basis.
The Total Return EPS CAPE built on GAAP earnings can serve as a reasonable upper bound for valuation. It’s unlikely that the market is more expensive than indicated by that measure. Similarly, the Total Return EPS CAPE built on operating earnings after 1998 can serve as a reasonable lower bound for valuation. It’s unlikely that the market is cheaper than indicated by that measure, especially considering that the 10 year average earnings off of which the Total Return EPS CAPE is built incorporate the substantially elevated levels of corporate profitability associated with the 2005 to 2015 period.
Now, to the charts. The following chart shows the hypothetical historical rolling average 10 year real total return that shareholders would have earned from January 1871 to March 2015 if valuations had stayed constant at Shiller CAPE levels of 5, 6, 7, 8, 9, 10, 11, 12, 13, 14, 15, 16, 17, 18, 19, 20, 21, 22, 23, 24, 25, 26, 27, 28, 29, and 30 respectively, with all dividends reinvested at those respective valuations.
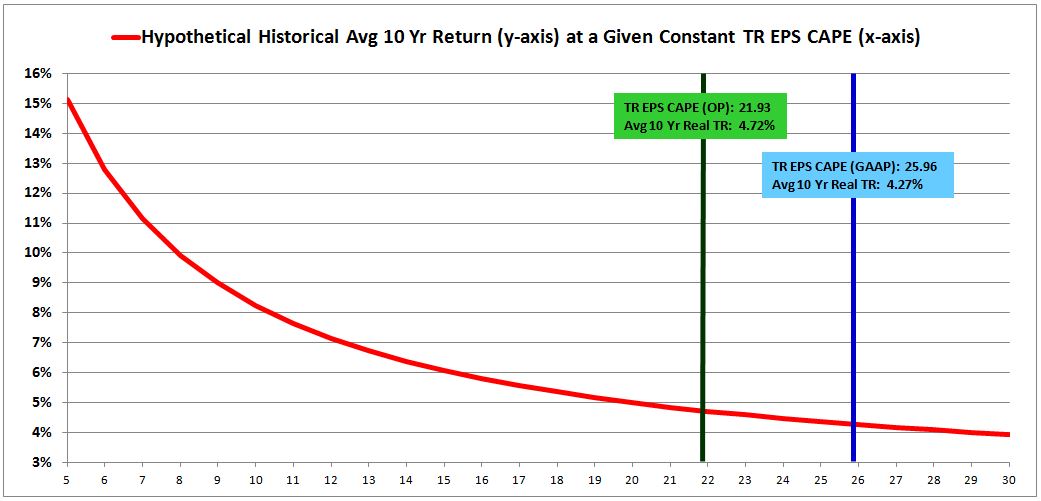
Let’s start with the left portion of the chart. If the Shiller CAPE had been equal to 5 throughout the entirety of U.S. market history, the average rolling 10 year real total return would have been north of 15%, more than double the actually realized value of roughly 6.3%. Moving to the right, if the Shiller CAPE had been equal to 30 throughout the entirety of U.S. market history, the average rolling 10 year real total return would have been under 4%. That’s with all other fundamentals held constant, the only differention coming from the different valuations at which the dividends are reinvested. It goes without saying that the difference–more than 1100 real bps of return per year–matters.
To home in on the current situation, if the Total Return EPS CAPE formed on operating earnings (the lower bound) is the more accurate measure of valuation, and if, going forward, the market remains unperturbed at the current value of 21.93, then we should expect a future total return of 4.72%. If the Total Return EPS CAPE formed on GAAP earnings (the upper bound) is the more accurate measure of valuation, and if, going forward, the market remains unperturbed at the current value of 25.96, then we should expect a future total return of 4.27%.
So there’s your range: 4.27% to 4.72%. If valuation bulls win both the valuation argument and the profit margin argument, then that is the approximate return they should expect. If they lose the valuation argument–if valuations fall back to the historical norm–then the drag described here will not apply. But a new drag will be inserted: the drag of falling valuation, which pulls down returns by pulling down prices.
The following chart shows the same information as the previous chart, but with the returns expressed as deviations from the historical average rolling 10 year total return of 6.32%.
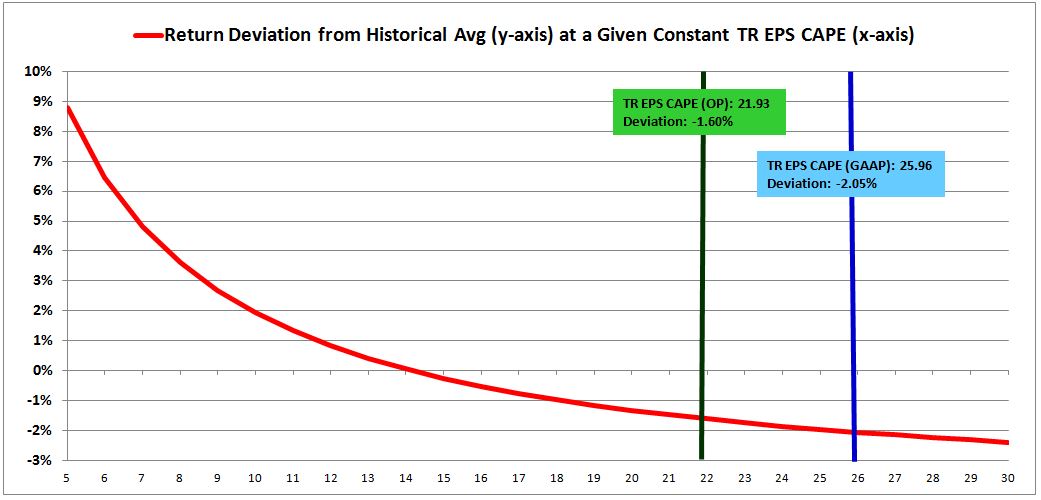
As you can see, a permanent CAPE of 5 would have added almost 9% to the actual average historical return. A permanent CAPE of 30 would have subtracted almost 2.5% from the actual average historical return. A permanent CAPE equal to the present value, somewhere between 21.93 and 25.96, would have subtracted anywhere from 1.60% to 2.05%. That range represents a quarter to a third of the actual historical return. So if market valuations stay where they are, on this “permanently elevated plateau”, investors should prepare to have anywhere from a quarter to a third of their future returns lopped off.
Now, valuation bulls might try to console themselves here by pointing out that reinvested dividends don’t matter as much to returns as they did in the past, since dividend payout ratios are substantially lower than they used to be. Wrong. The same dividends are still being paid out, they’re just being paid out in a different form: in the form of share buybacks and corporate M&A. The buybacks and M&A activities are being conducted at the same elevated valuations that the dividends would have been reinvested at. So the result is the same.
In fact, if anything, the depressing future impact of permanently elevated valuations is likely to be more severe in the current market than it would have been in past markets. In past markets, corporations grew EPS by investing in organic business growth, which isn’t affected by the market’s valuation. The current era, however, is characterized by a reduced emphasis on organic business growth, and an increased emphasis on EPS growth through share count reduction–what is perjoratively termed “capital recycling.”
Currently, almost 100% of S&P 500 EPS is being devoted to capital recycling–some combination of dividends, buybacks, and buyouts. The growth that this recycling will produce will be entirely determined by the market’s valuation–nothing else can make a difference to it but that. And so if these simulations in historical data are telling us that we should mark down our future return expectations by 25% to 33% of the historical norm, then we should probably mark them down by an even greater amount, because the underlying allocation practice through which they will be driven down–capital recycling that occurs in lieu of organic business growth–is significantly more prevalent now than it was in prior eras.